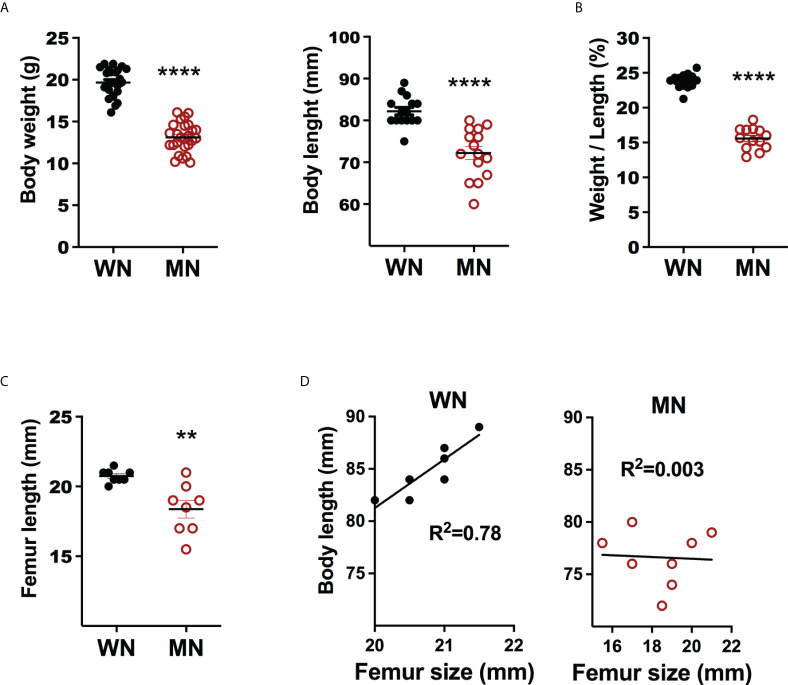
Figure 1.
Body and bone metrics of control and malnourished mice. 3-week old BALB/c mice were placed on the isocaloric control and nutrient-deficient diets for 28 days and body weight and body and femur length measured. (A) Body weight (g) and body length (mm) of naïve control (well-nourished; WM) and malnourished (MN) mice. Data pooled of 4 different experiments with >5 mice per group in each experiment. (B) Ratio of body weight (g) to body length (mm) (W/L) in naive well-nourished (WN) and malnourished mice (MN). Data pooled of 2 experiments with 8 mice per group. (C) Femur length (mm) in WN and MN mice. Data are from a single experiment representative of 2 experiments with 8 mice per group, (D) Correlation of body length vs. femur length in WN and MN mice. Data are from a single experiment representative of 2 experiments with 8 mice per group. **p<0.01, ****p<0.0001.

