. 2022 Aug 16;130(8):087006. doi: 10.1289/EHP10287

Figure 1.

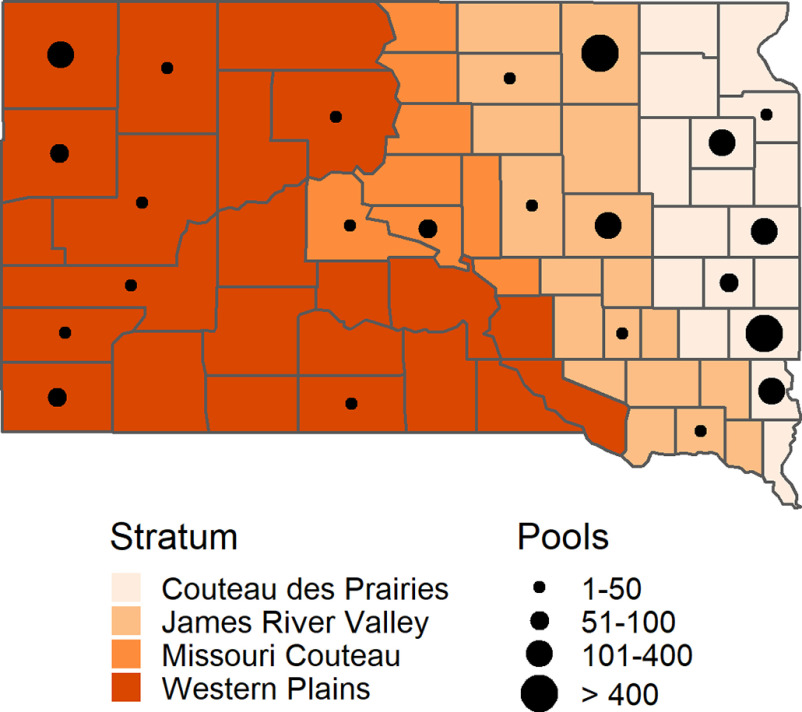
Figure 1 is a map of South Dakota, United States, depicting the total number of tested mosquito pools from 2004 to 2019 and the modeling of the mosquito infection growth rate in the counties by using the geographic strata. The Stratum is divided into four categories, namely, Couteau des Prairies, James River Valley, Missouri Couteau, and Western Plains. A scale depicts Pools ranges as 1 to 50, 51 to 100, 101 to 400, and greater than 400.

South Dakota counties with total number of tested mosquito pools from 2004 to 2019 and geographic strata used for modeling the mosquito infection growth rate (MIGR). Strata were delineated based on patterns of mosquito surveillance along with climate and physiography, and their names refer to the major physiographic zones with which they are associated. Map drawn using R (version 4.2.1; R Development Core Team).