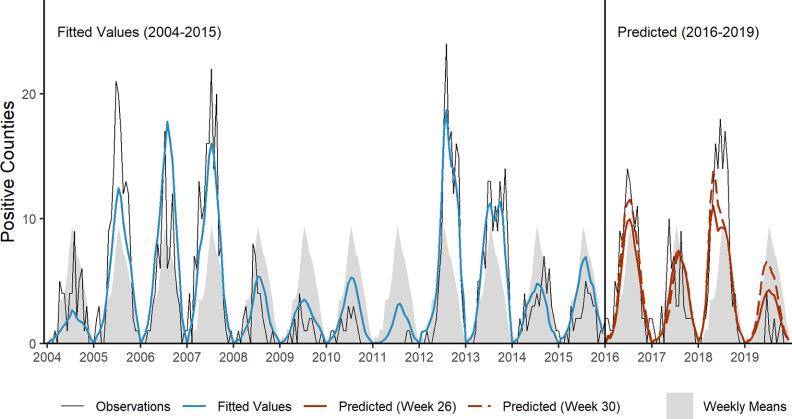
Figure 5.
Observed numbers of counties with one or more West Nile virus cases per week from 2004 to 2019 in South Dakota and predictions from the two-model ensemble (Ens2). Ensemble predictions are the mean of predictions from the combined mosquito–environment model with distributed lags of meteorological anomalies (CombAnom) and the combined mosquito–environment model with seasonally varying distributed lags of meteorological anomalies (CombSvAnom). Fitted values are shown from 2004 to 2015 and predictions outside of the training data set from 2016 to 2019. Predictions are shown for two forecast weeks: 26 (late June) and 30 (late July). Shaded areas represent the weekly means of observed positive counties across all years.

