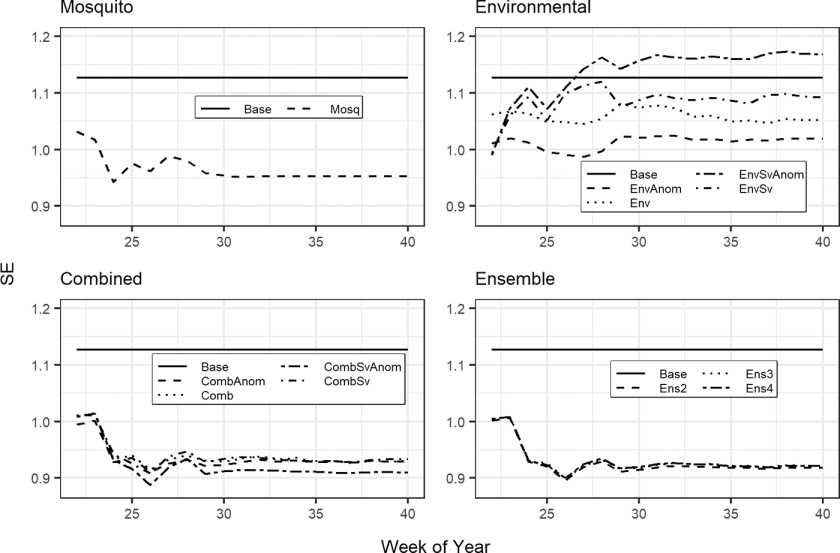
Figure 6.
Accuracy of South Dakota West Nile virus predictions from 2016 to 2019 measured as spatial error (SE), which is the mean absolute error of predicted positive weeks per county. Predictions were generated using the Arbovirus Monitoring and Prediction (ArboMAP) software with 13 different model formulations. Each line represents the variation in SE by forecast week for one model. The logistic regression models incorporated various combinations of mosquito infection variables and lagged meteorological variables (temperature and vapor pressure deficit) with different variable transformations and model structures. Individual models are defined in Table 1 and mathematical forms are provided in Table 2. Note: Base, baseline; Comb, combined; CombAnom, combined with anomalies; CombSv, combined with seasonally varying distributed lags; CombSvAnom, combined with anomalies and seasonally varying distributed lags; Ens2, two model ensemble; Ens3, three model ensemble; Ens4, four model ensemble; Env, environmental; EnvAnom, environmental with anomalies; EnvSv, environmental with seasonally varying distributed lags; EnvSvAnom, environmental with anomalies and seasonally varying distributed lags; Mosq, mosquito.

