. 2022 Aug 16;130(8):087006. doi: 10.1289/EHP10287

Figure 7.

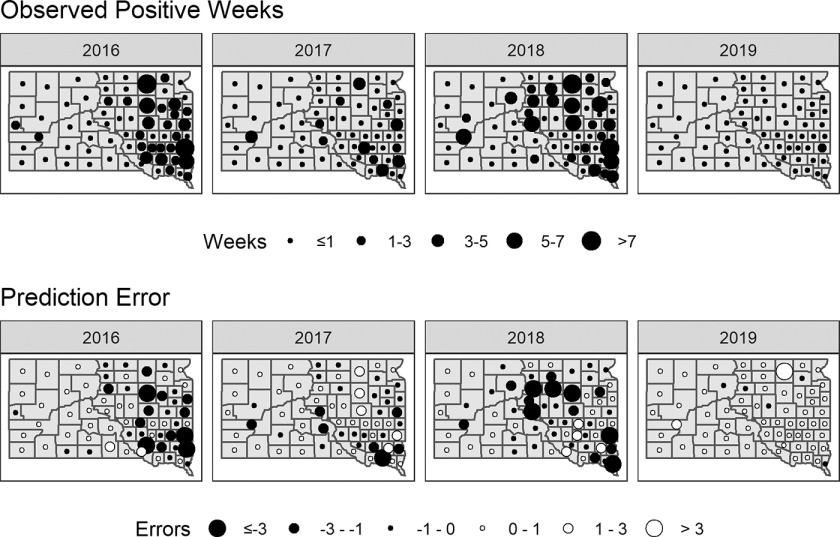
Figure 7 is a set of eight maps of South Dakota, United States. The first four maps are grouped under Observed positive weeks, depicting one or more West Nile virus cases from 2016 to 2019. The week is divided into five categories, including less than or equal to 1, 1 to 3, 3 to 5, 5 to 7, and greater than 7. The last four maps are grouped under Prediction Error, depicting the difference between the predicted number and the observed number of positive weeks for each county in each year. The errors are divided into seven categories, including less than or equal to negative 3, negative 3 to negative 1, negative 1 to 0, 0 to 1, 1 to 3, and greater than 3.

Observed numbers of weeks with one or more West Nile virus cases from 2016 to 2019 in South Dakota and prediction errors from the two-model ensemble (Ens2). Ensemble predictions are the mean of predictions from the combined mosquito–environment model with distributed lags of meteorological anomalies (CombAnom) and the combined mosquito–environment model with seasonally varying distributed lags of meteorological anomalies (CombSvAnom). Prediction error is the difference between the predicted number of positive weeks and the observed number of positive weeks for each county in each year. Map drawn using R (version 4.2.1; R Development Core Team).