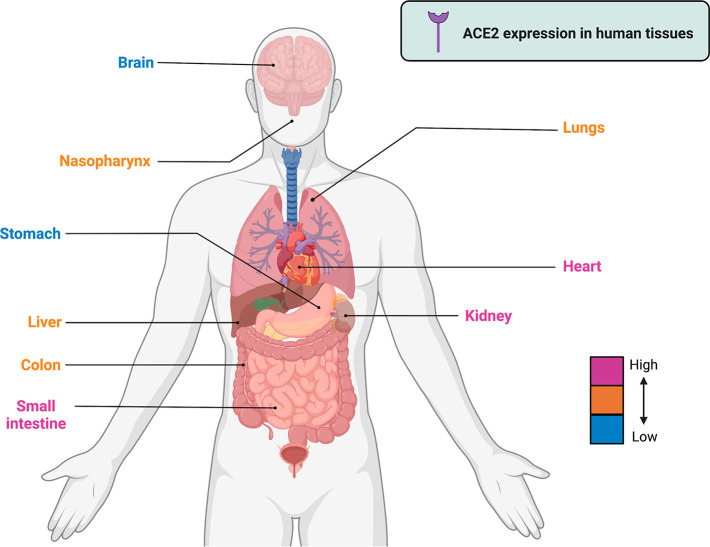
Figure 8.
Gene expression of the ACE2 receptor in human tissues. The level of expression in each organ is categorized from high to low using different colors. Sources: https://www.proteinatlas.org/ENSG00000130234-ACE2/tissue and Li et al. (2020).183 This figure was created with Biorender.com.

