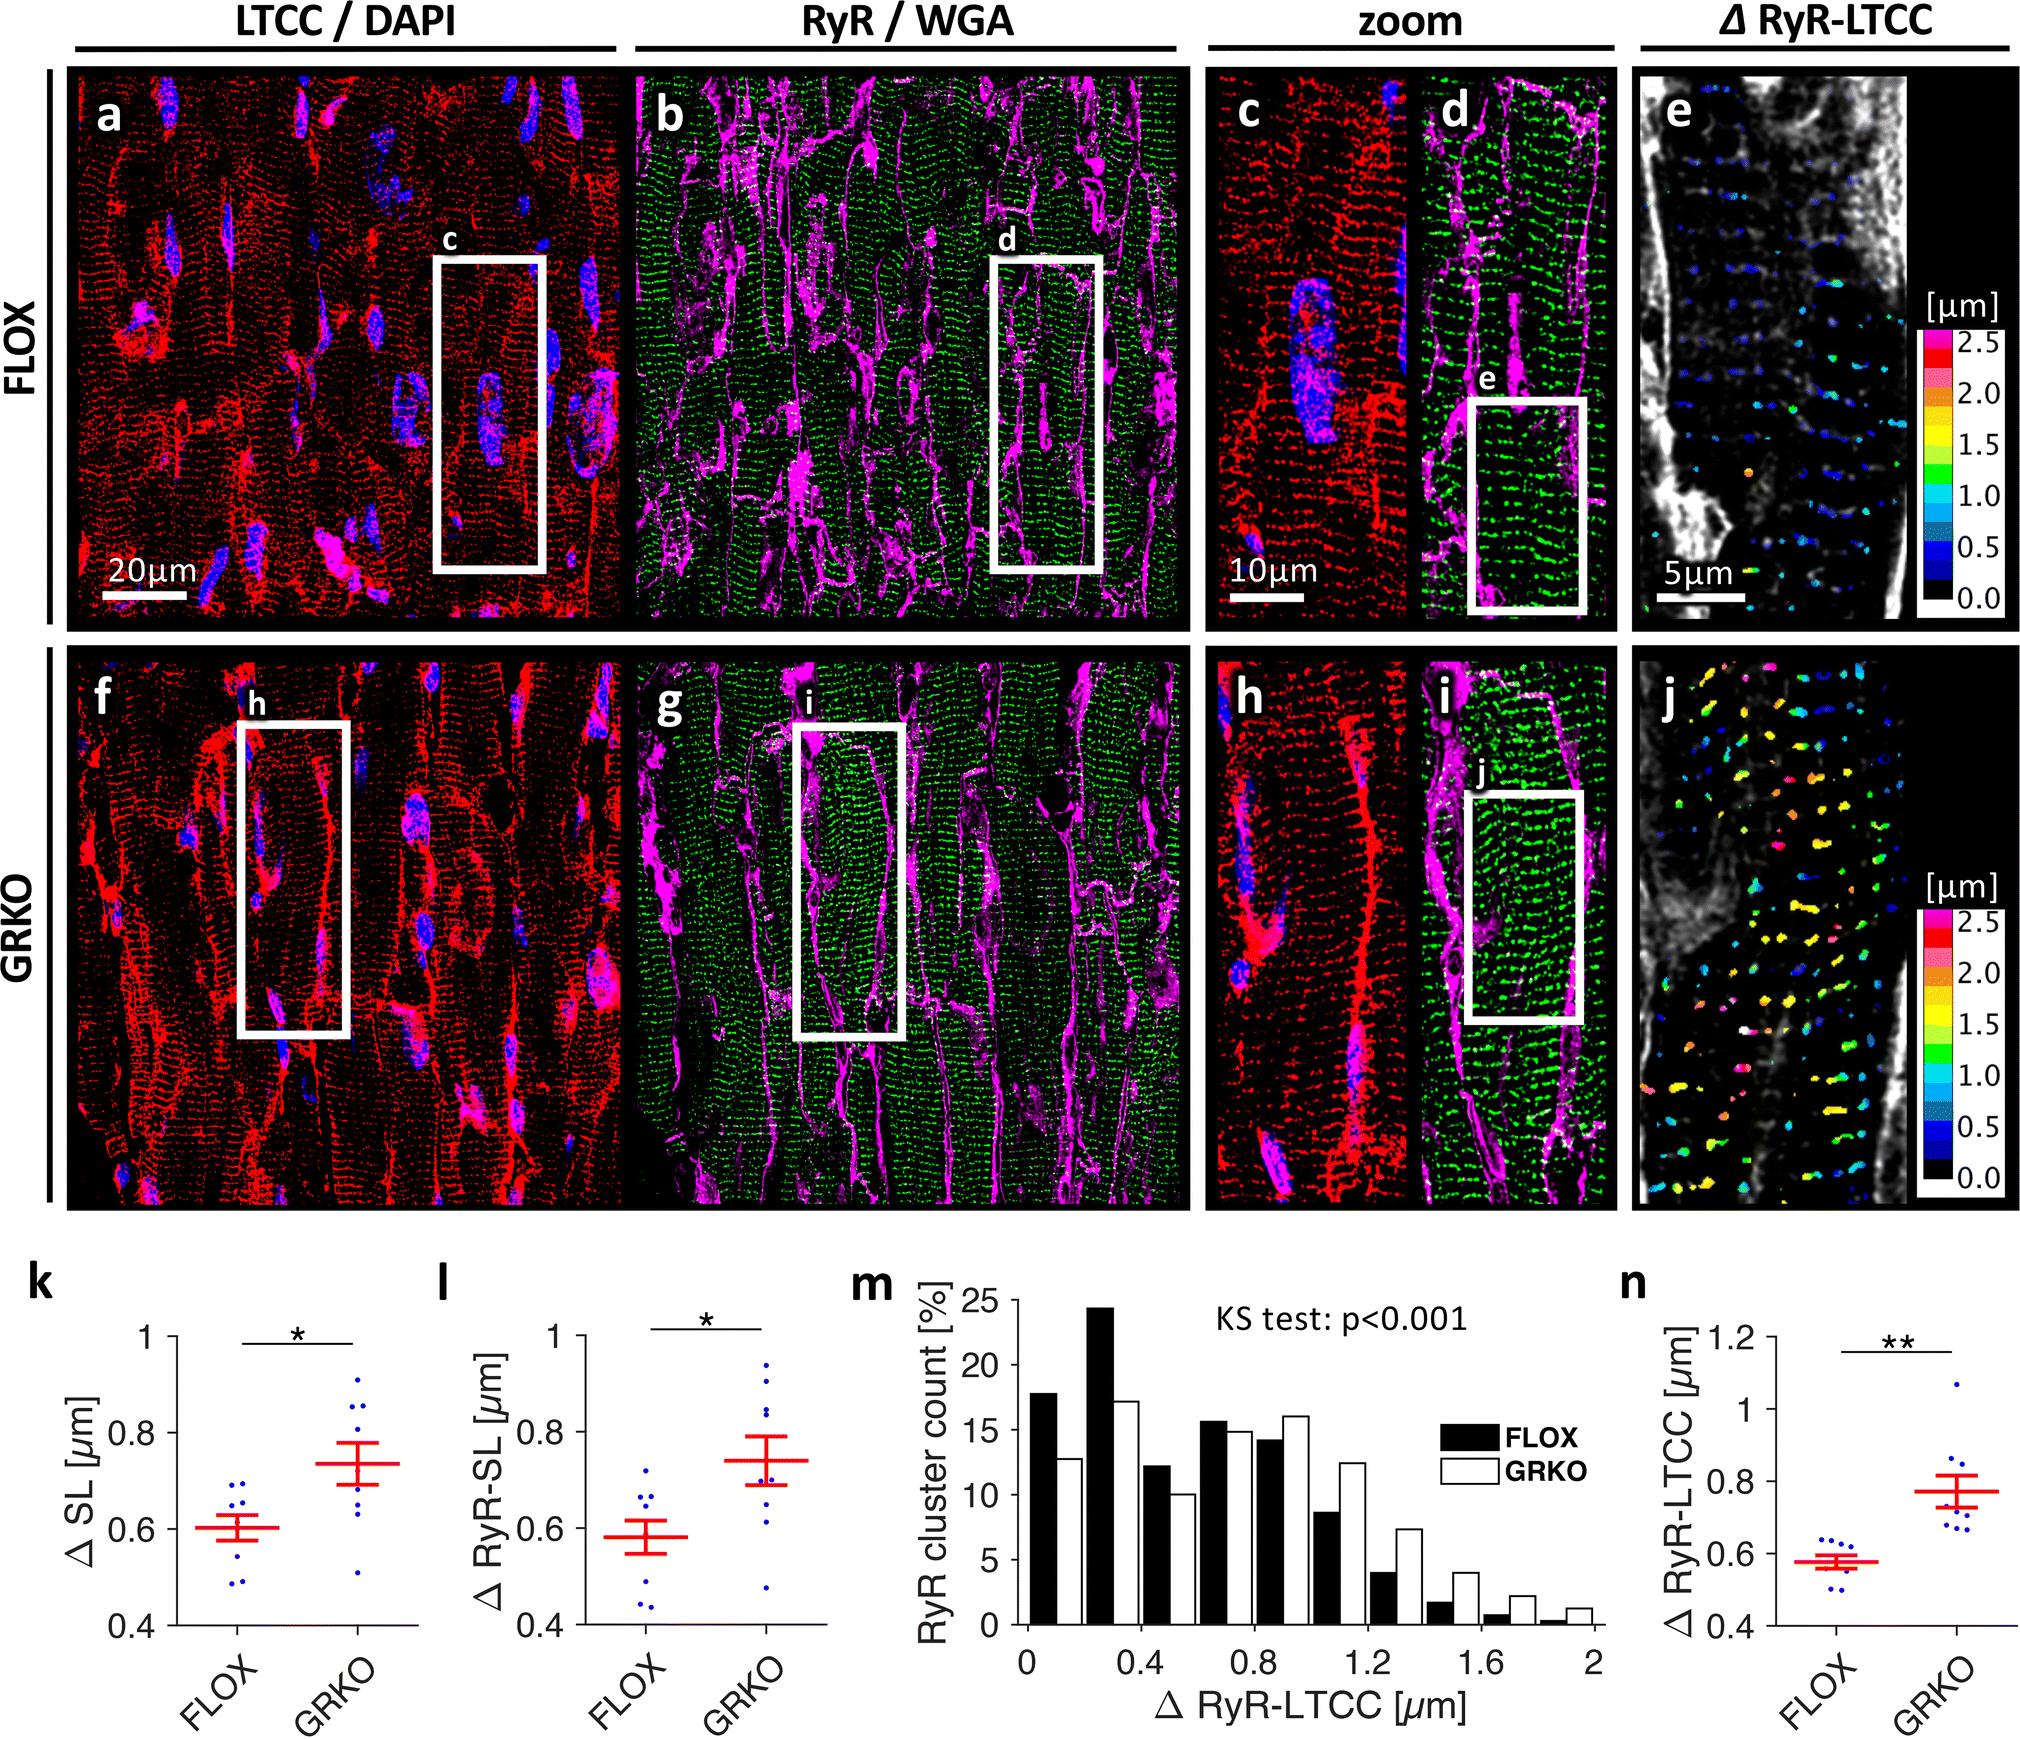
Figure 1.

Confocal images of cardiac tissue sections from three-month old mice, A-E, control (FLOX) and, F-J, cardiomyocyte-specific GR knockout (GRKO). Sections were stained for L-type Ca2+ channels (LTCC, red in A, C, F, H), ryanodine receptors (RyR, green in B, D, G, I), nuclei (DAPI, blue in A, C, F, H), and with wheat germ agglutinin (WGA) for the sarcolemma and extracellular matrix (magenta in in B, D, G, I). E and J, Color-coded distances from RyR clusters to their closest LTCC cluster (ΔRyR-LTCC). Scale bar in A also applies to B, F, G. Scale bar in C also applies to D, H, I. Scale bar in E also applies to J. K, Mean intracellular distance to closest sarcolemma (ΔSL) and, L, mean RyR cluster distance to closest sarcolemma (ΔRyR-SL) as measures of t-tubule density. M, Distribution of ΔRyR-LTCC in FLOX and GRKO tissue. The Kolmogorov-Smirnov (KS) test was applied to test for equal distributions. N=478,215/480,486 clusters. N, Mean ΔRyR-LTCC. Data were obtained from n=9/3 samples/animals in each group. *p<0.05 (two-tailed Welch’s t-test)
