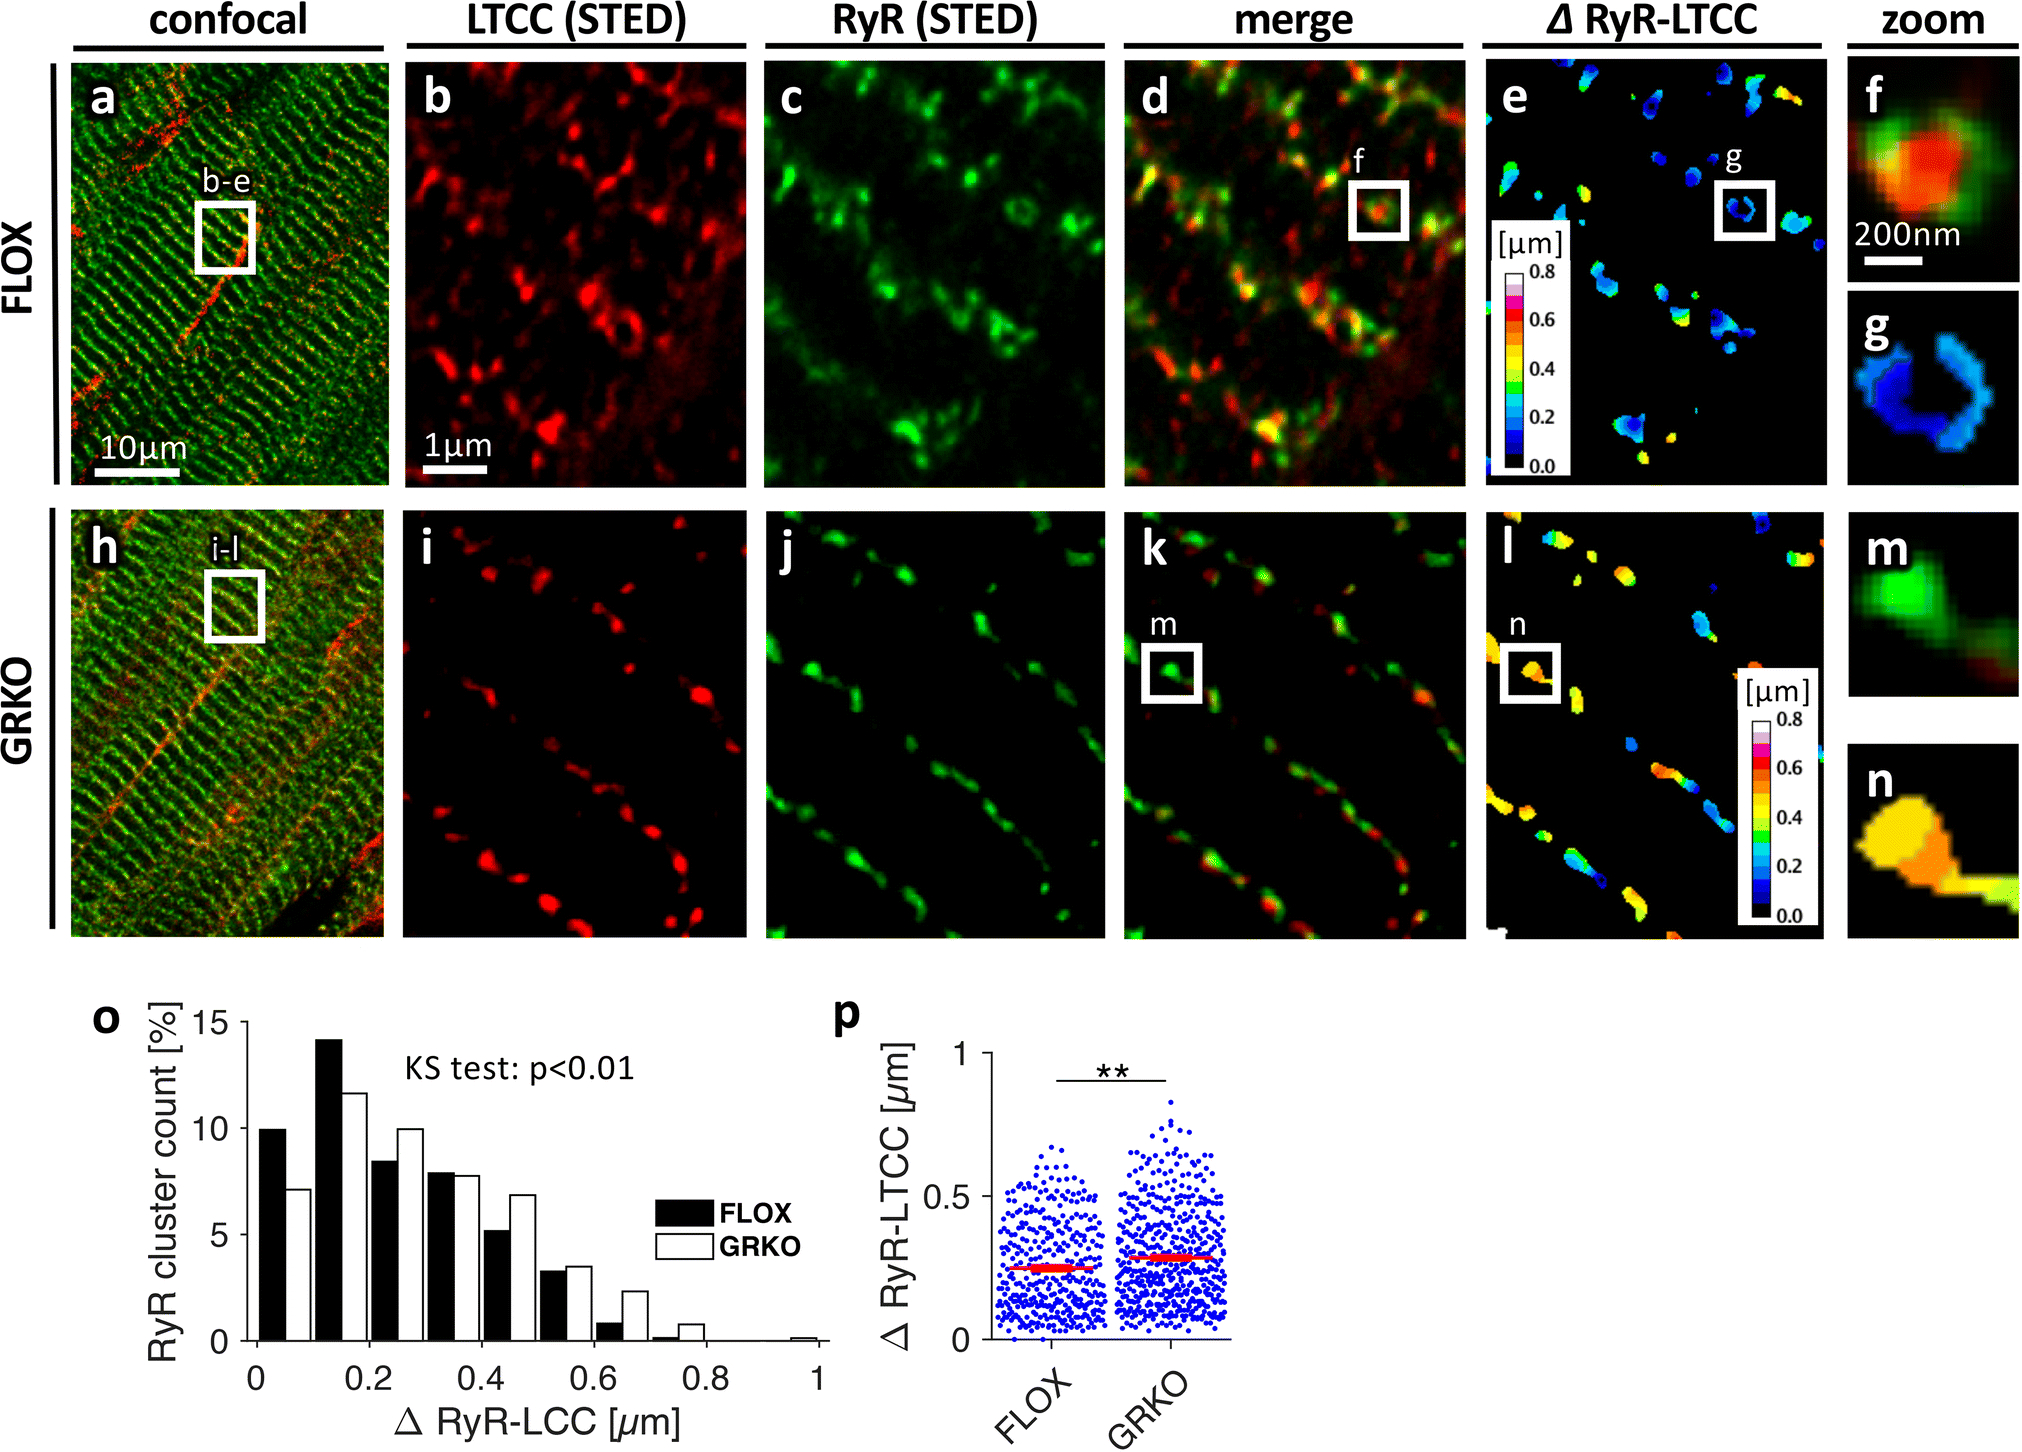
Figure 2.

Three-dimensional STED microscopy of cardiac tissue sections from three-month old, A-G, control (FLOX) and, H-N, GRKO mice. Sections were stained for LTCCs (red in A, B, D, F, H, I, K, M) and RyRs (green in A, C, D, F, H, J, K, M). E, G and L, N, Color-coded distances from RyR clusters to their closest LTCC cluster (ΔRyR-LTCC). Scale bar in A also applies to H. Scale bar in B also applies to C-E and I-L. Scale bar in F also applies to G, M, N. O, Distribution of ΔRyR-LTCC in FLOX and GRKO tissue. KS test: Kolmogorov-Smirnov test for equal distribution. P, ΔRyR-LTCC obtained from n=359/494 analysed RyR clusters from 9/9 image stacks (6.6×6.6×3μm3) and 3/3 FLOX or GRKO animals, respectively. **p<0.01 (two-tailed Welchs’s t-test, clusters as statistical units)
