Figure 5.

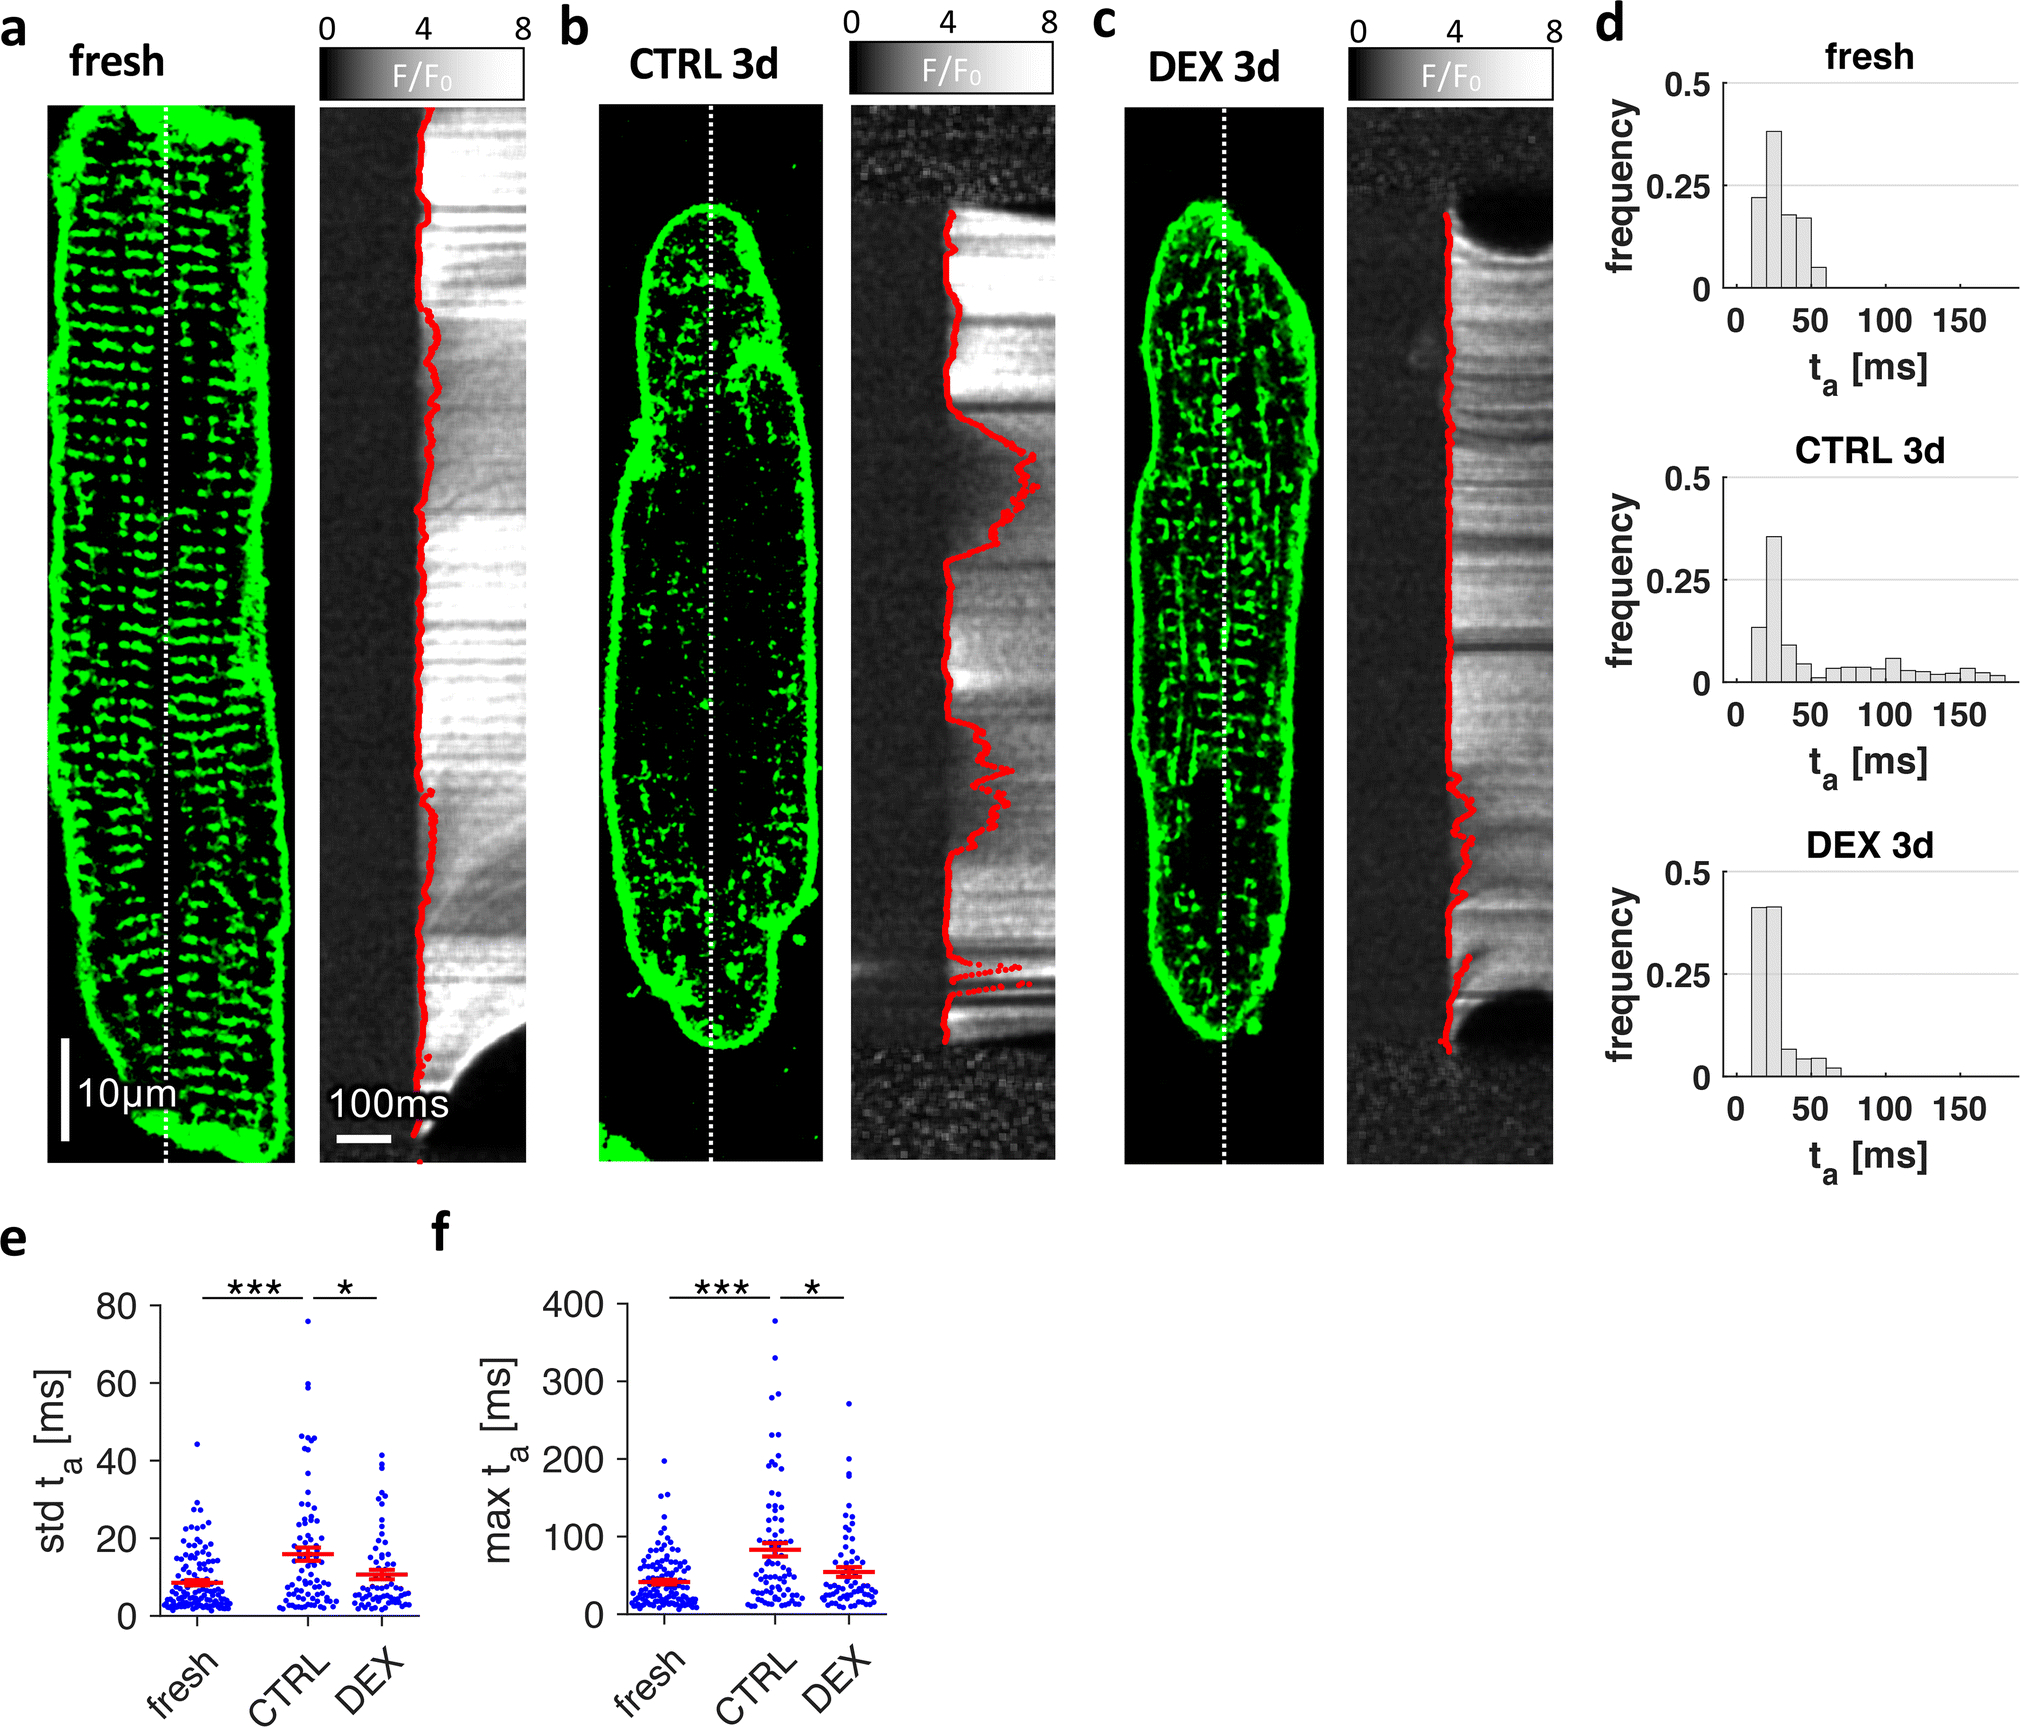
Effect of dexamethasone on stimulated cytosolic Ca2+ rise in cultured rat cardiomyocytes. Freshly isolated myocytes (fresh) and myocytes cultured for 3 days in vehicle (CTRL3d) or 1μmol/L dexamethasone (DEX3d) were stained with Di-8-ANEPPS, loaded with Fluo-4-AM as Ca2+ indicator and then field-stimulated. A-C, Examples of 2D confocal images with corresponding line scans recorded along the dotted lines with 1.89ms/line (530Hz). F/F0 shows the relative fluorescence intensity with respect to baseline intensity before stimulation. Red lines show the points of maximum increase in fluorescence intensity (dF/dtmax), determined by curve fitting algorithms. Local activation time of Ca2+ rise, ta, was defined as the time of dF/dtmax. D, Histograms of ta of the cells shown in A-C. E, Standard deviation (std) of ta, and, F, maximum local ta, obtained from fresh and cultured cells. Scale bar in A also applies to B and C. ***p<0.001, **p<0.01, *p<0.05, n (cells/animals) = 100/9, 82/8, 67/8 in fresh, CTRL3d, DEX3d, respectively. Two-tailed Welch’s t-test was used for all tests, with multiple comparison correction.
