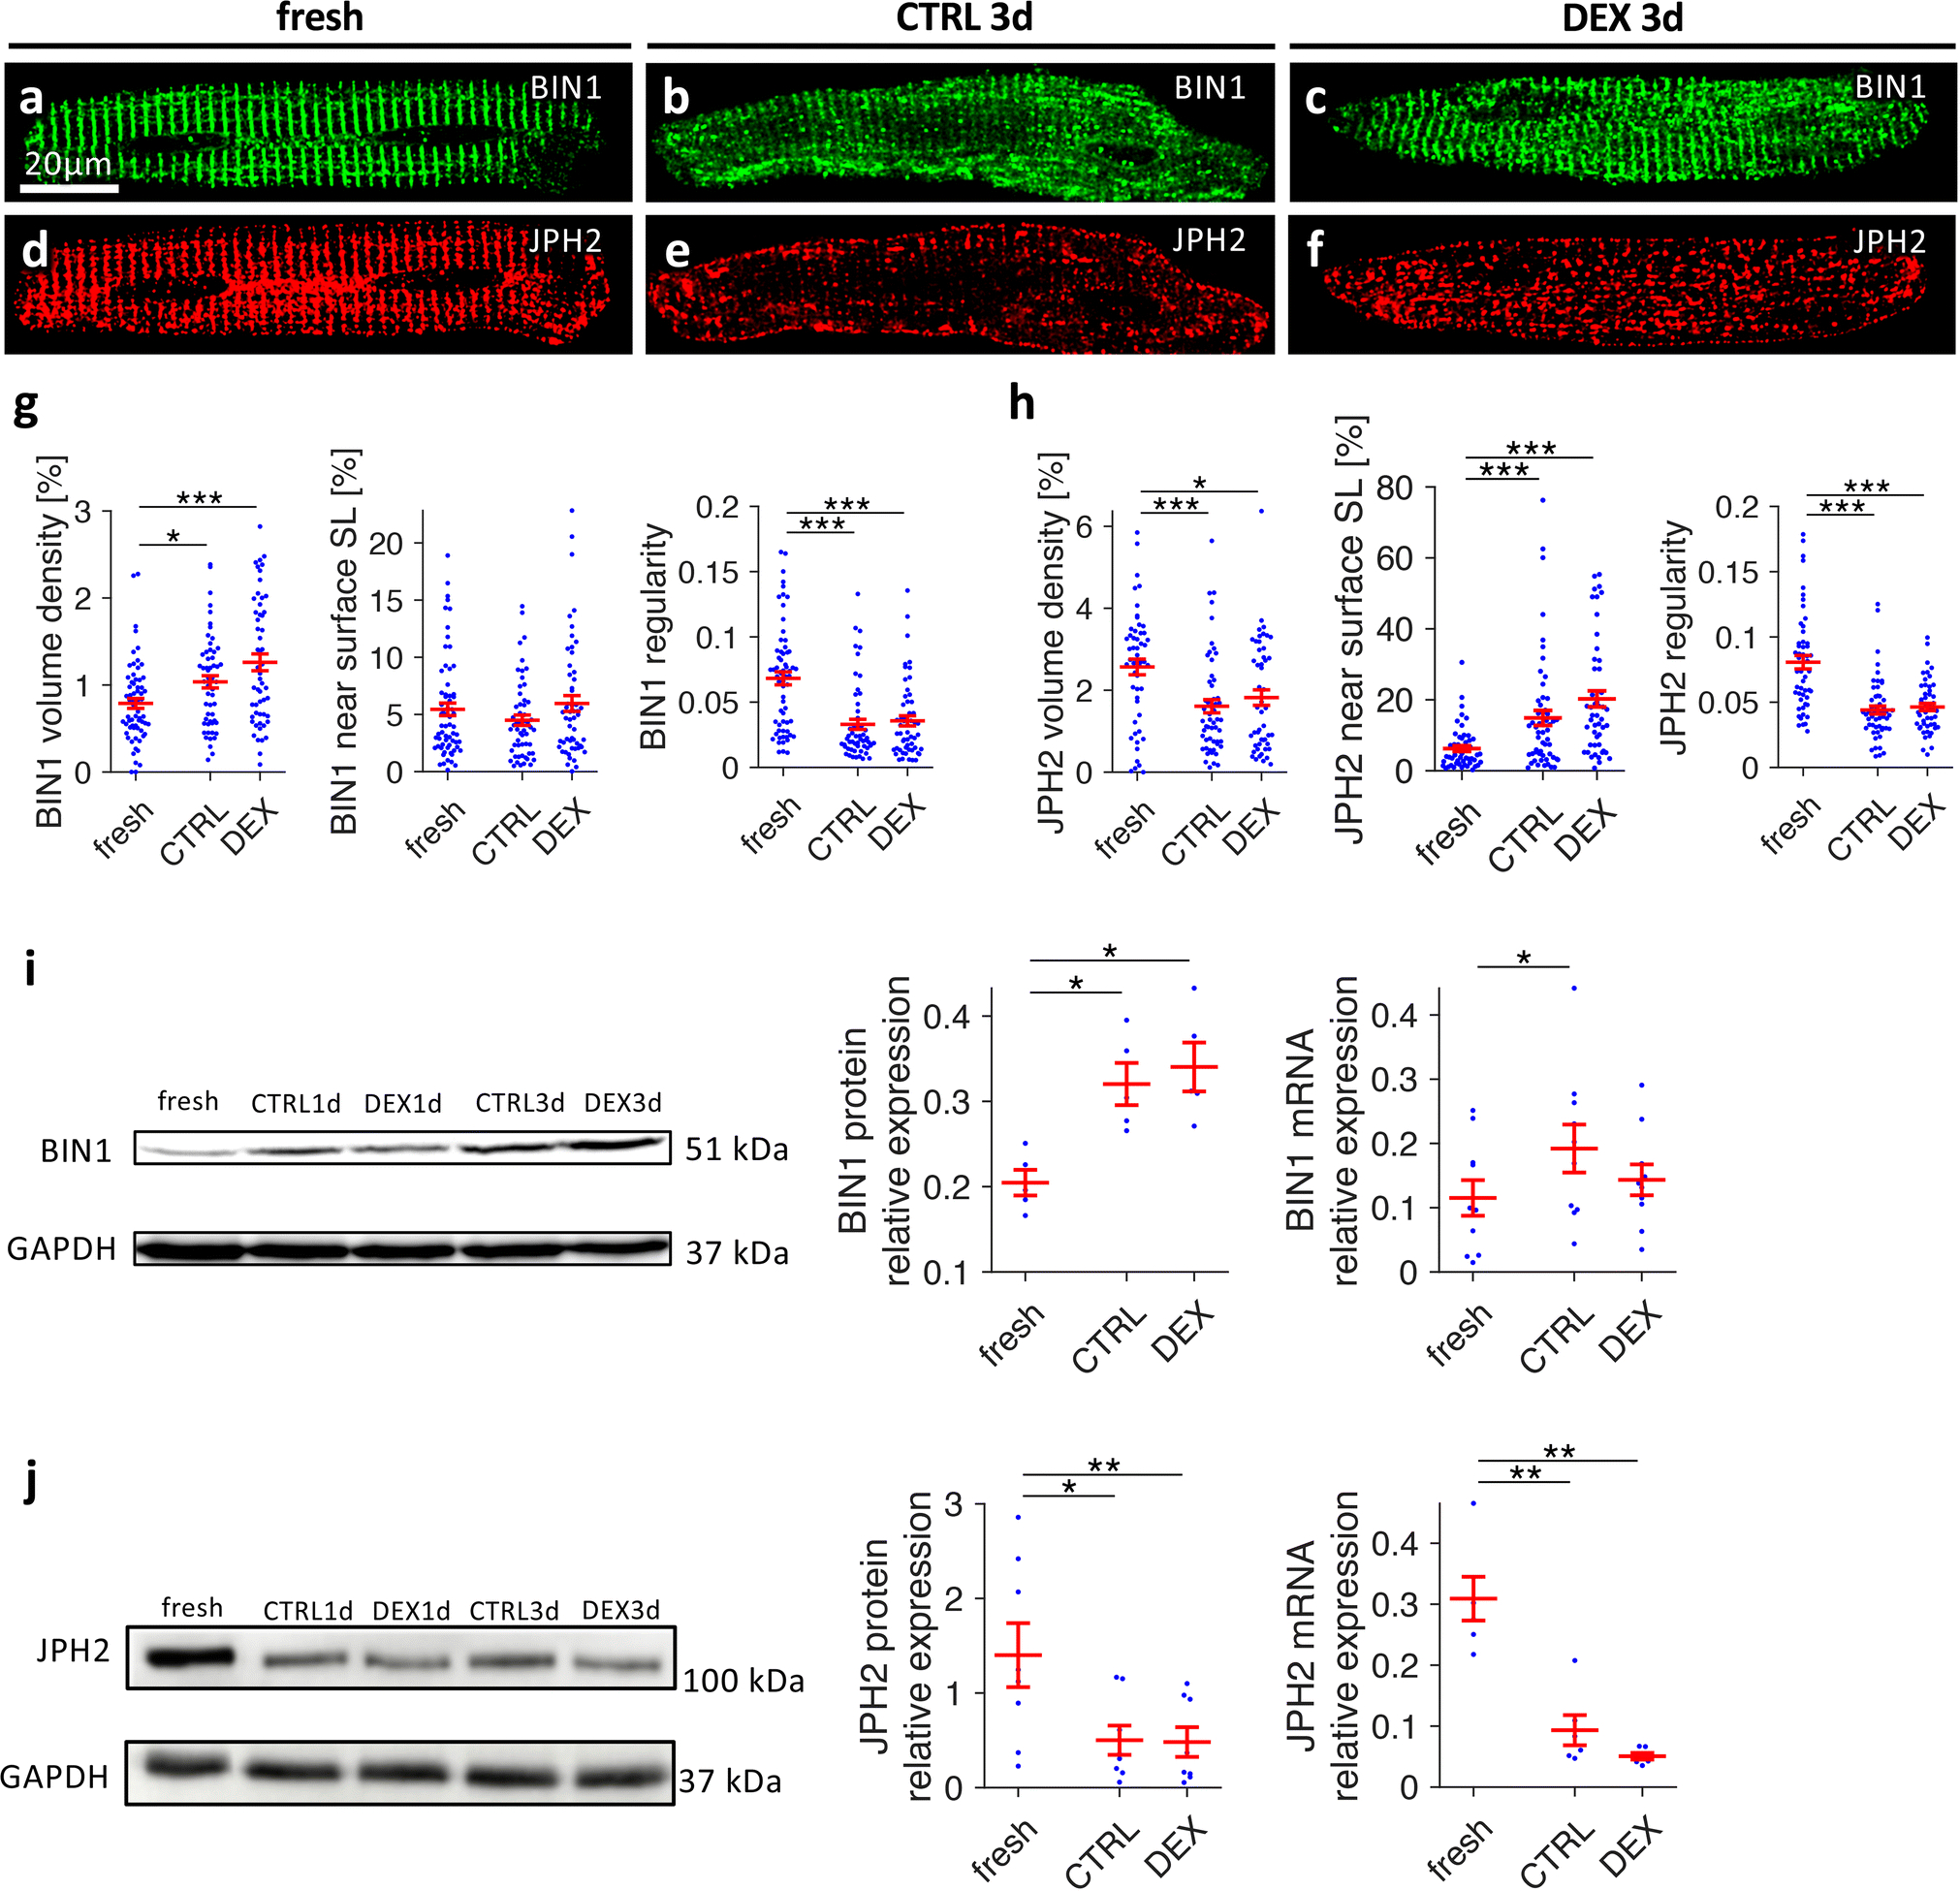
Figure 6.

Effects of dexamethasone on distribution and expression of BIN1 and JPH2 in cultured rat cardiomyocytes. Freshly isolated myocytes (fresh) and myocytes cultured for 3 days in vehicle (CTRL3d) or 1μmol/L dexamethasone (DEX3d) were fixed, co-immunostained for BIN1 (green) and JPH2 (red), and analysed by three-dimensional confocal microscopy. A-C, BIN1, D-F, JPH2. Scale bar in A also applies to B-F. G, Quantitative analysis of BIN1 volume density, percentage of BIN1 near (< 0.5μm) the surface sarcolemma (SL), and BIN1 spectral density as a measure of spatial regularity. n (cells/animals) = 65/8, 56/8, 55/8 in fresh, CTRL3d, DEX3d, respectively, from matched cell isolations. H, Quantitative analyses of JPH2 immunostaining, as shown for BIN1 in G. n (cells/animals) = 53/7, 56/7, 50/7 in fresh, CTRL3d, DEX3d, respectively, from matched cell isolations (two-tailed Welch’s t-test with multiple comparison correction). I, BIN1 protein and mRNA expression levels. BIN1 protein expression was assessed by Western blot quantification (normalization by Ponceau staining) in fresh, CTRL3d and DEX3d cells, n=5 matched cell isolations. BIN1 mRNA expression assessed by quantitative RT-PCR in fresh, CTRL1d and DEX1d cells (normalized to reference genes, see Methods), n=10 matched cell isolations (paired t-test with multiple comparison correction). J, JPH2 protein and mRNA expression levels as described for BIN1 in I. Western blot: n=8 matched cell isolations, qPCR: n=6 matched cell isolations (paired t-test with multiple comparison correction). ***p<0.001, **p<0.01, *p<0.05
