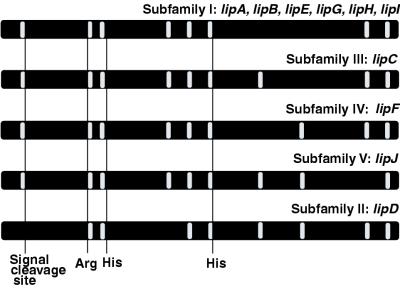
FIG. 1.
Classification of lip genes by intron/exon structure. Introns and exons are represented by white and black bars, respectively. The positions of conserved amino acid residues coordinating the heme (49) the relative positions of signal cleavage sites and are indicated.

