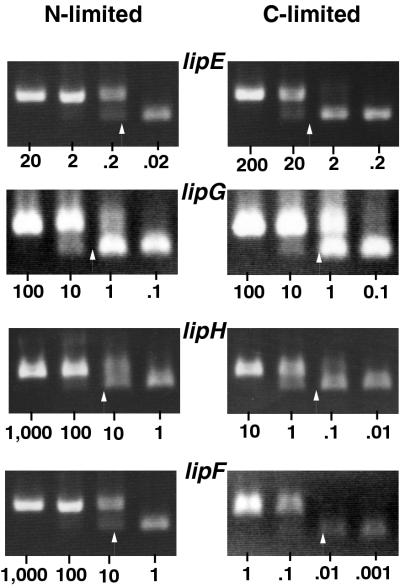
FIG. 4.
Competitive PCRs comparing four lip transcripts in samples harvested from nitrogen- or carbon-limited conditions. Transcript levels were estimated by determining the equivalence points (arrows) with competitive templates (46). The amount of plasmid competitive template added to each PCR is indicated below the gels and expressed in picograms. Ethidium bromide-stained gels were photographed with a Foto/Analyst Visionary system (Fotodyne, Hartland, Wis.) and scanned with a Microtek ScanMaker III and Adobe Photoshop 3.0.

