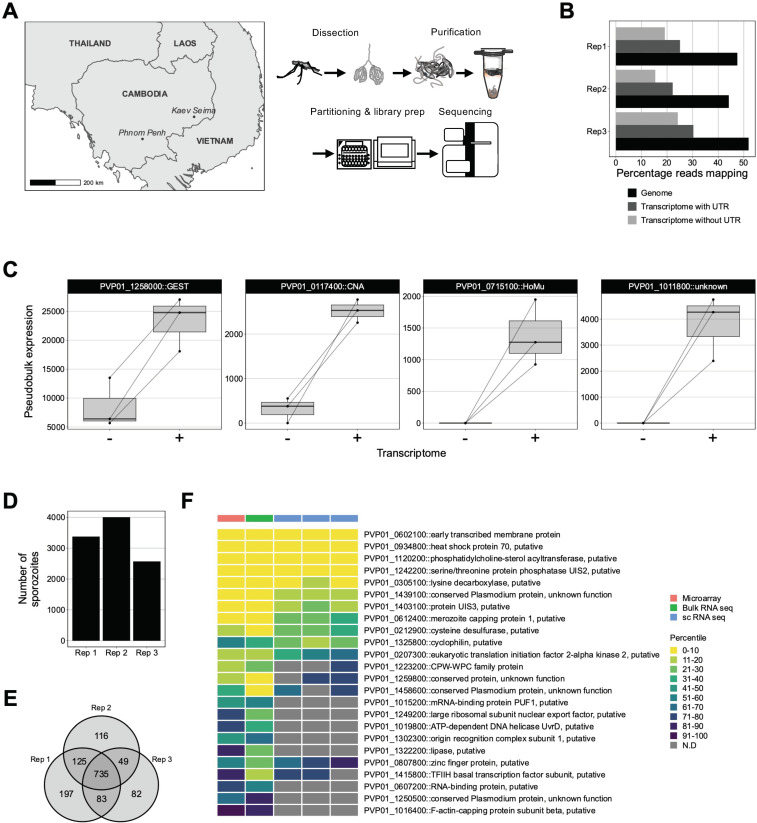
Fig 1. Strategy used to assess P. vivax sporozoite transcriptomes at single-cell resolution.
(A) Schematic illustrating the geographical region, sample preparation and sequencing pipeline used to capture single-cell transcriptomes of P. vivax sporozoites. (B) Percentage of reads aligning to the P. vivax P01 genome and transcriptome (with- or without- UTR information) across the three replicates. (C) ‘Pseudobulk’ visualisation of UMI counts aligned to P. vivax P01 transcriptome without (-) or with (+) UTR information. (D) Number of sporozoite transcriptomes retained post cell- and gene- filtering. (E) Number of unique and overlapping genes detected across scRNA-seq datasets. (F) Comparison of orthologous up-regulated in infective sporozoites (UIS) genes (obtained from P.berghei) across three high-throughput sequencing technologies (microarray: Westenberger et al. 2009, bulk-RNA seq: Muller et al. 2019 and single-cell RNA seq; current study). To account for the differences in the total number of genes detected across technologies, gene expression values were compared using percentile ranks. GEST: gamete egress and sporozoite traversal; CNA: serine/threonine protein phosphatase 2B catalytic subunit A; HoMu: RNA-binding protein Musashi; UTR: untranslated region.

