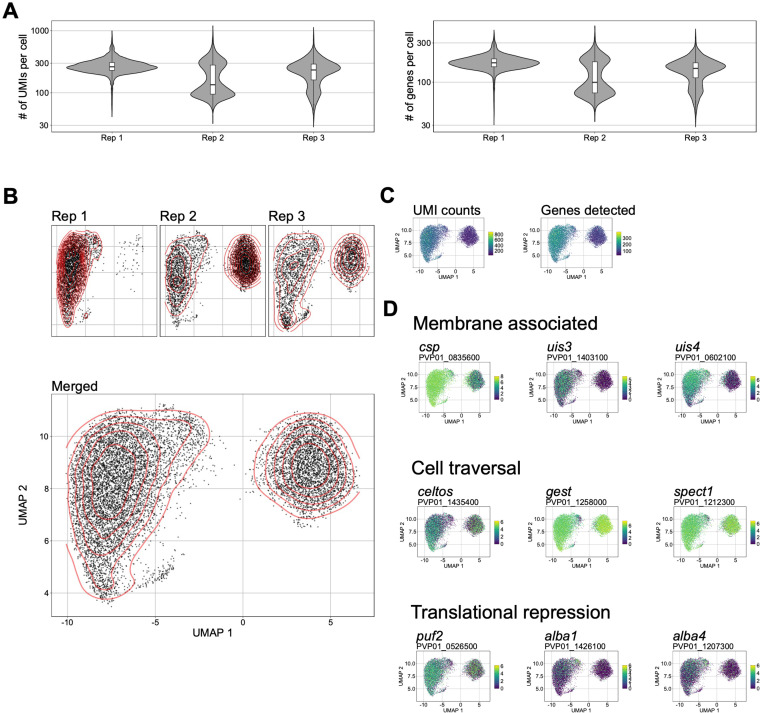
Fig 2. Analysis of P. vivax sporozoite gene expression at single-cell resolution.
(A) Violin plots (with boxplox overlaid) showing the distribution of unique molecular identifiers (UMIs) per cell (left), and genes detected be cell (right). (B) UMAPs of P. vivax sporozoite transcriptomes, visualized per replicate (upper) and combined (lower). Red-lines represent the density of cells represented in low dimensional space. (C) UMAPs of P. vivax transcriptomes colored by total number of UMIs (left) and total number of genes detected (right) per cell. (D) UMAPs of P. vivax sporozoite transcriptomes. Cells colored by expression of various genes implicated in sporozoite biology. Scale bar: normalised expression. csp: circumsporozoite protein; uis3: upregulated-in-infective sporozoites 3; uis4: upregulated-in-infective sporozoites 4; celtos: cell-traversal protein for ookinetes and sporozoites; gest: gamete egress and sporozoite traversal; spect1: sporozoite microneme protein essential for cell traversal 1; puf2: mRNA-binding protein PUF2; alba1: DNA/RNA binding protein Alba1; alba4: DNA/RNA binding protein alba4.

