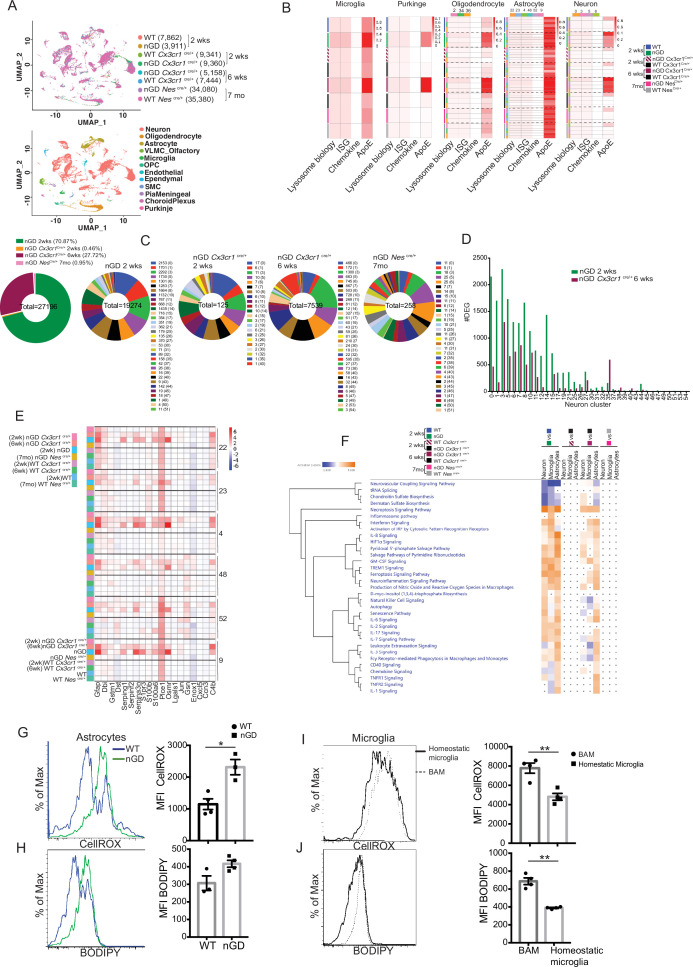
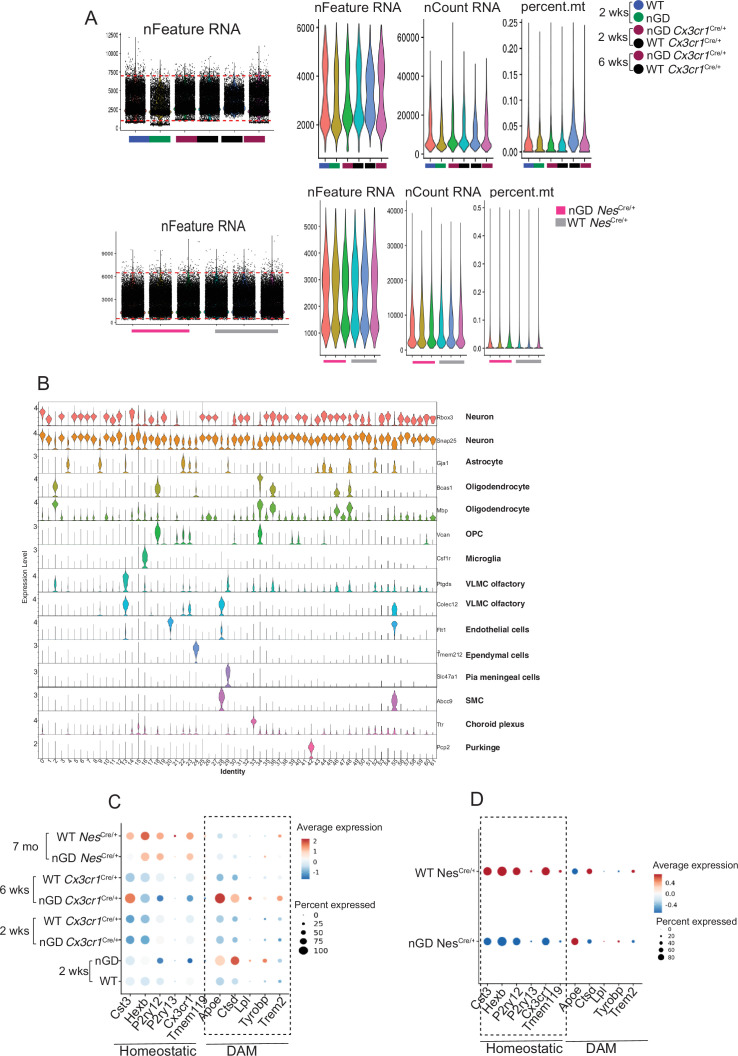
Figure 5. snRNA-seq reveals key role of microglia astrocytes and neurons in Gaucher disease (GD)-associated neuroinflammation.
(A) UMAP data from neuronopathic Gaucher disease (nGD) (2 weeks old), nGD Cx3cr1Cre/+ (2 and 6 weeks old, respectively), nGD NesCre/+ mice (n = 3), and corresponding control mice, colored by genotype (top) and cell clusters (bottom). (B) AUC analysis for select lysosome, Interferon signature genes (ISG), chemokine, and Apoe gene sets significantly enriched (false discovery rate [FDR] < 0.05) in microglia, Purkinje, oligodendrocyte, astrocyte, and neuro clusters of nGD (2 weeks) vs. control mice; nGD Cx3cr1Cre/+ (2 and 6 weeks, respectively) vs. control mice; nGD NesCre/+ mice vs. control mice. Row side bar colors indicate mice genotype, age and cell clusters. (C) Pie chart displays the number of differentially expressed genes (DEGs) in neuronal clusters of nGD (2 weeks) vs. control mice (green); nGD Cx3cr1Cre/+ (2 weeks [orange] and 6 weeks [maroon], respectively); nGD NesCre/+ mice (pink) vs. control mice with log2(fold change) and adjusted p-value < 0.05. Total DEGs from each set of mice are stated in the middle of pie chart with number of DEGs and the neuronal cluster in brackets shown to the right of each pie chart. (D) Bar graph represents the number of DEGs in neuronal clusters of nGD 2 weeks (green) vs. nGD Cx3cr1Cre/+ 6 weeks (maroon) with log2(fold change) and adjusted p-value < 0.05. (E) Heat map of DEGs associated with disease-associated astrocytes (DAA) from nGD; nGD Cx3cr1Cre/+ (2 weeks and 6 weeks, respectively); nGD NesCre/+ mice vs. control mice. p<0.05 was considered significant (two-sided t-tests). All individual DAA genes with significant differential expression are listed on bottom and the astrocyte clusters are shown in right. Red, positive z-score; white, zero z-score; blue, negative z-score. (F) Ingenuity pathway analysis (IPA) from nGD vs. WT, nGD Cx3cr1Cre/+ vs. WT Cx3cr1Cre/+ at 2- and 6-week-old mice; nGD NesCre/+ mice vs. WT NesCre/+ in neuron cluster, microglia, and astrocytes. Orange, positive z-score; white, zero z-score; blue, negative z-score; gray dots are statistically insignificant. (G) Representative flow cytometry histogram (left) and quantification of CellROX fluorescence in astrocytes. (H) Histogram (left) and quantification (right) of BODIPY fluorescence in astrocytes of nGD mice. (I) Flow cytometry histogram (left) and quantification (right) of CellROX fluorescence in activated and homeostatic microglia from nGD mice. (J) Histogram (left) and quantification (right) of BODIPY fluorescence in activated and homeostatic microglia from nGD mice n = 3–4 mice per group. Data were replicated in at least two independent experiments. Unpaired t-test, two-tailed was used to test significance. *p<0.05, **p<0.001, and ***p<0.0001.


