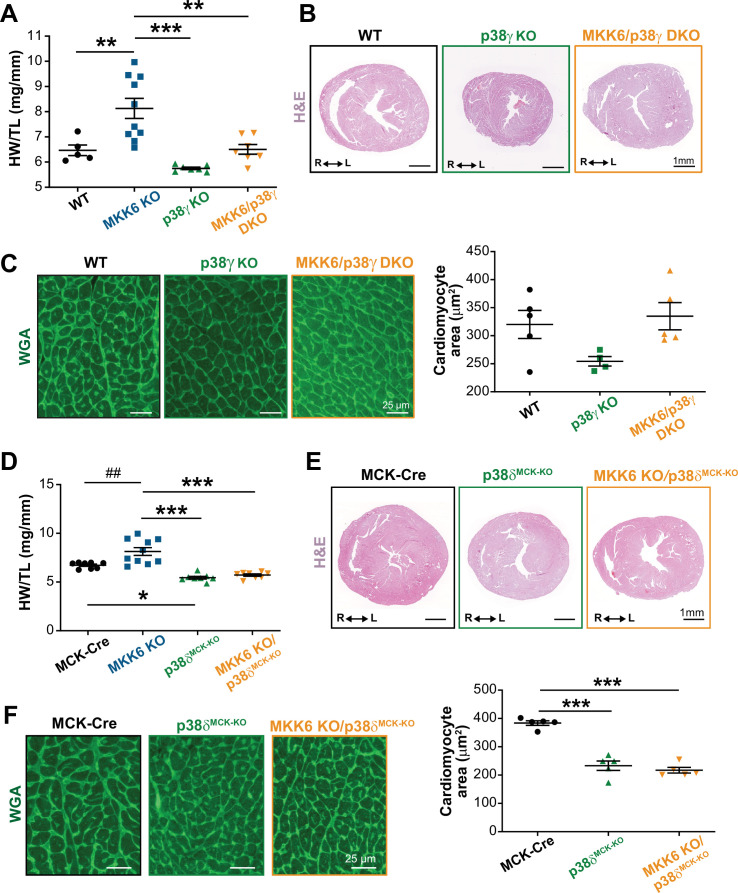
Figure 6. Loss of p38γ/δ in cardiomyocytes rescues the cardiac hypertrophy induced by MKK6 deficiency.
All phenotypes shown come from 9-week-old mice. (A) Heart weight to tibia length ratio in wild type (WT) (n=5), MKK6 KO (n=10), p38γ KO (n=7), and MKK6/p38γ DKO (n=7) mice. One-way ANOVA followed by Tukey’s post-test. (B) Representative hematoxylin and eosin (H&E)-stained transverse heart sections from WT, p38γ KO, and MKK6/p38γ DKO mice. Scale bars: 1 mm. (C) Representative FITC wheat germ agglutinin (FITC-WGA) staining and corresponding quantification of cardiomyocyte cross-sectional area in WT (n=5), p38γ KO (n=4), and MKK6/p38γ DKO (n=5) mice. Scale bars: 25 µm. One-way ANOVA followed by Tukey’s post-test. (D) Heart weight to tibia length ratio in MCK-Cre (n=8), MKK6 KO (n=10), p38δMCK-KO (n=8), and MKK6 KO/p38δMCK-KO (n=8) mice. Kruskal-Wallis test with Dunn’s post-test (##p<0.01 Mann-Whitney U test). (E) Representative H&E-stained transverse heart sections from MCK-Cre, p38δMCK-KO, and MKK6 KO/p38δMCK-KO mice. Scale bars: 1 mm. (F) Representative FITC-WGA staining and corresponding quantification of cardiomyocyte cross-sectional area in MCK-Cre (n=5), p38δMCK-KO (n=5), and MKK6 KO/p38δMCK-KO (n=5) mice. One-way ANOVA followed by Tukey’s post-test. Scale bars: 25 µm. The same data from MKK6 KO mice were used in (A) and (D). Means ± SEM is shown. *p<0.05; **p<0.01; ***p<0.001; ##p<0.01.

