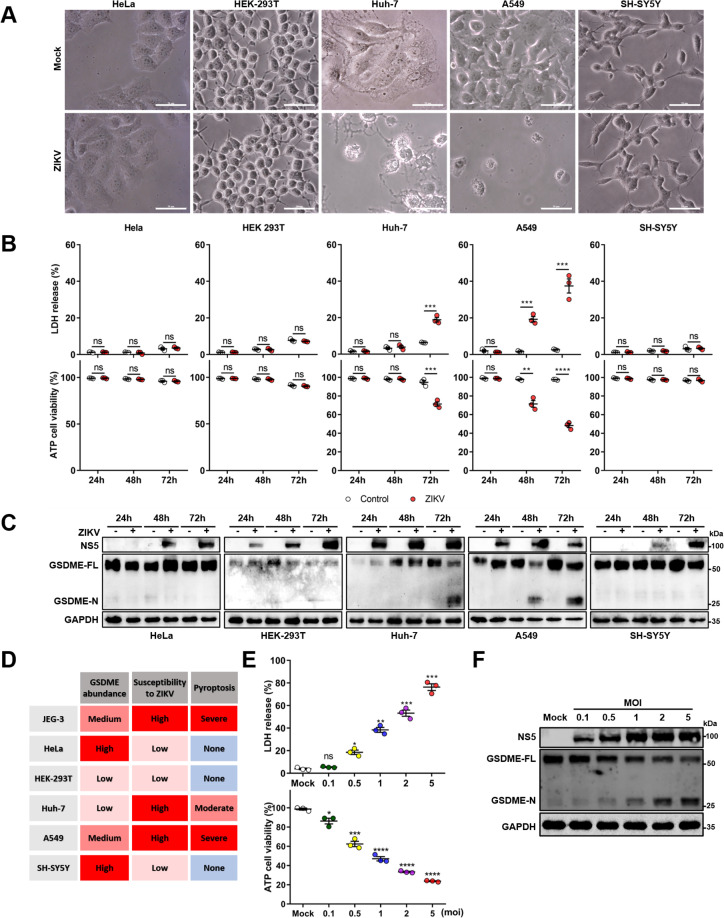
Figure 2. Both the cellular gasdermin E (GSDME) abundance and the susceptibility to Zika virus (ZIKV) infection determine the occurrence of pyroptosis.
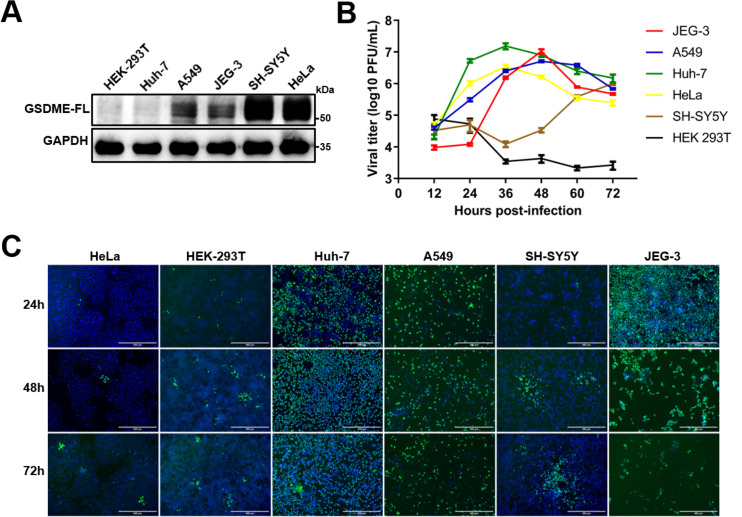
(A–C) Relevant cells were infected with ZIKV at a multiplicity of infection (MOI) of 1. At indicated time post-infection, cells were subjected to microscopy, cytotoxicity, and Western blot analyses. Phase-contrast images of ZIKV-induced pyroptotic cell death in HeLa, HEK 293T, Huh-7, A549, and SH-SY5Y cells at 72 hr post-infection. Scale bar, 50 μm (A). Comparison of ATP cell viability, LDH release-based cell death (n=3) (B), and GSDME cleavage (C) in ZIKV-infected relevant cells. (D) Table summarizing results shown in (A–C), and Figure 2—figure supplement 1 from ZIKV infection experiments with relevant cell lines. The abundance of GSDME, the replication and infection levels of ZIKV in cells, and the ZIKV-induced LDH release were quantified. The cells showing the highest abundance of GSDME (SHSY-5Y), susceptibility to ZIKV (JEG-3), and degree of pyroptosis (JEG-3) were considered as references. Those cells are defined as high (severe) if their corresponding index is higher than the 75% of reference, medium (moderate) if the index is between 75% and 25%, and low (none) when the index is less than the 25% of the reference. (E and F) Analyses of ATP cell viability, LDH release-based cell death (n=3) (E), and GSDME cleavage (F) in JEG-3 cells at 36 hr post-infection. Unpaired t-test versus mock. LDH release (B, E) is presented as the mean ± SEM of three independent experiments, and the two-tailed unpaired Student’s t-test was used to calculate significance. *, p<0.05; **, p<0.01; ***, p<0.001; ****, p<0.0001; ns, no significance.


