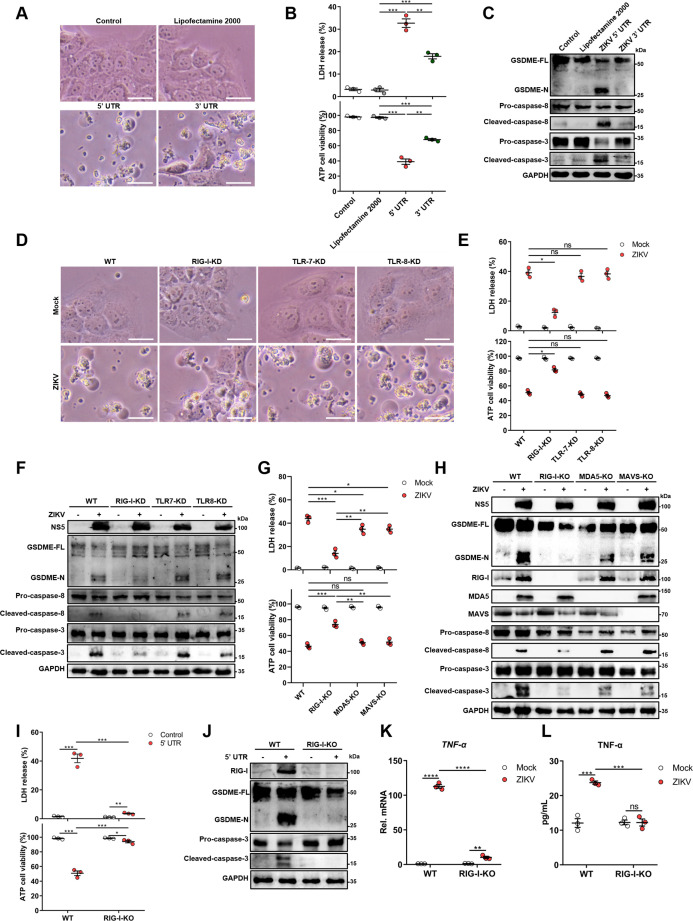
Figure 4. The genomic RNA of Zika virus (ZIKV) activates the gasdermin E (GSDME)-dependent pyroptosis through the RIG-I-caspase-8-caspase-3 pathway.
(A–C) JEG-3 cells were seeded in six-well plates and were transfected with 1 μg ZIKV 5’ untranslated region (UTR) or 3’ UTR. At 24 hr post-transfection, cells were subjected to microscopy (A), cytotoxicity (n=3) (B), and Western blot analyses (C). Scale bar, 50 μm. (D–F) RIG-I, TLR7, or TLR8 knockdown JEG-3 cells or wild-type (WT) JEG-3 cells were infected with ZIKV at a multiplicity of infection (MOI) of 1. At 24 hr post-infection, cells were subjected to microscopy (D), cytotoxicity (n=3) (E), and immunoblot analyses (F). Scale bar, 50 μm. (G–H) ZIKV-infected JEG-3 cells were infected with ZIKV. At 24 hr post-infection, the cells were subjected to cytotoxicity (n=3) (G) and Western blot analyses (H). (I–J) JEG-3 cells and RIG-I KO JEG-3 cells were seeded in six-well plates and were transfected with 1 μg ZIKV 5’ UTR. At 24 hr post-transfection, cells were subjected to cytotoxicity (n=3) (I) and Western blot analyses (J). (K–L) JEG-3 or RIG-I KO JEG-3 cells were mock-infected or infected with ZIKV at an MOI of 1. The mRNA level (K) and concentration of TNF-α in the culture supernatant (L) (n=3) was determined by RT-qPCR and enzyme-linked immunosorbent assay (ELISA), respectively. All data are presented as the mean ± SEM of three independent experiments, and the two-tailed unpaired Student’s t-test was used to calculate significance. **, p<0.01; ***, p<0.001; ****, p<0.0001; ns, no significance. RIG-I, retinoic acid-inducible gene I; TLR, Toll-like receptor.


