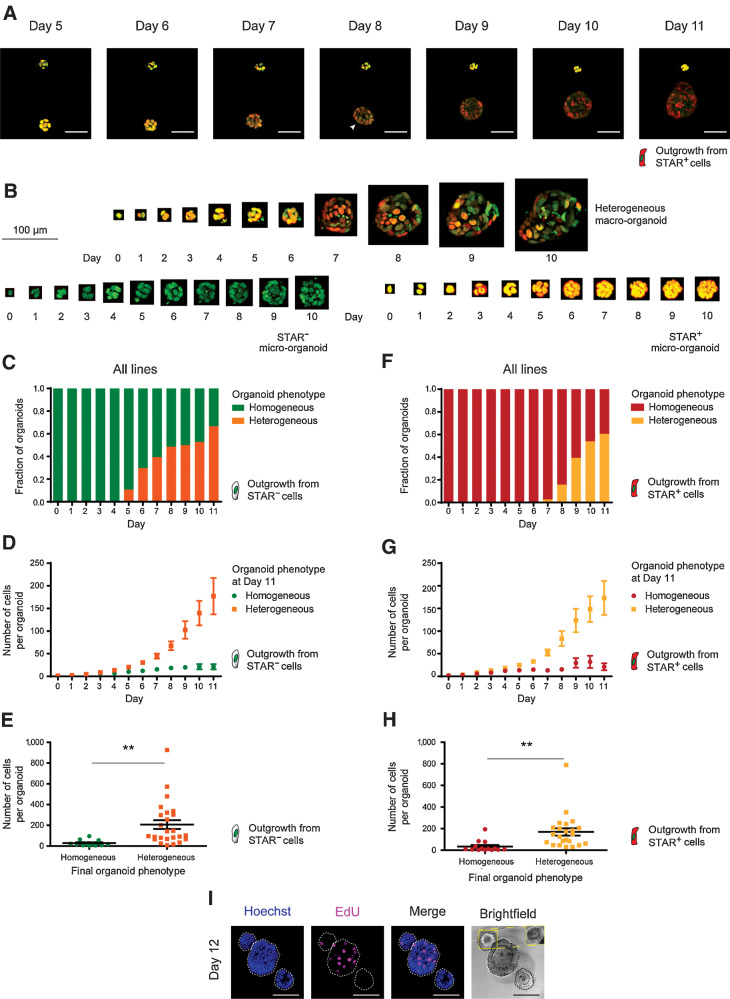
Figure 3.
Colorectal cancer organoids phenocopy the cellular dynamics during metastatic outgrowth. A, Stills from live-cell recordings of A/K/P/S–mutant organoid formation (day 5 to 11) from single nuclear STAR+ cells (red). Top, organoid fails to establish heterogeneity and stagnates in growth. Bottom, organoid develops cellular heterogeneity, indicated by varying STAR levels and continues to grow. Nuclei are marked with a chromatin tag (green). Color hues are red/green overlaid (resulting in yellow to dark orange). Arrowhead, symmetry break. Scale bars, 50 µm. B, 3D-rendered pictures of single cells growing into either a heterogeneous organoid (top) or into homogeneous STAR− (bottom left) or STAR+ (bottom right) micro-organoids. Nuclei (green), STAR (nuclear, red), overlay (yellow). Scale bar, 100 µm. C–H, Pooled data of four human colorectal cancer organoid lines. Engineered APCKO/KO/KRASG12D/–/TP53KO/KO (A/K/P), APCKO/KO/KRASG12D/–/TP53KO/KO/SMADKO/KO (A/K/P/S), PDO P16T, and PDO P19bT. Data are stratified by STAR identity at the time of plating. Outgrowth of STAR−/STAR+ cells with homogeneously STAR− (green)/STAR+ (red) organoids and heterogeneous organoids (orange/yellow). C and F, Graph representing the fraction of organoid phenotypes per indicated time point during the outgrowth of STAR–/STAR+ colorectal cancer cells. D and G, Graph representing the size (mean cell number + SEM) of developing organoids from single STAR–/STAR+ cells, stratified by final phenotype. E and H, Organoid size per final phenotype for the outgrowth of single STAR–/STAR+ cells. Two-tailed Student t test (P value, 0.0070/0.0045) indicates significant difference. I, Three 12-day-old organoids with EdU incorporation (pink) to label proliferative cells. Blue, counterstain Hoechst 33342. Inset (yellow) shows optimal brightfield cross-section. Scale bars, 100 µm. **, P < 0.01.

