. 2022 Mar 15;10(5):571–580. doi: 10.1158/2326-6066.CIR-21-0457

Figure 1.

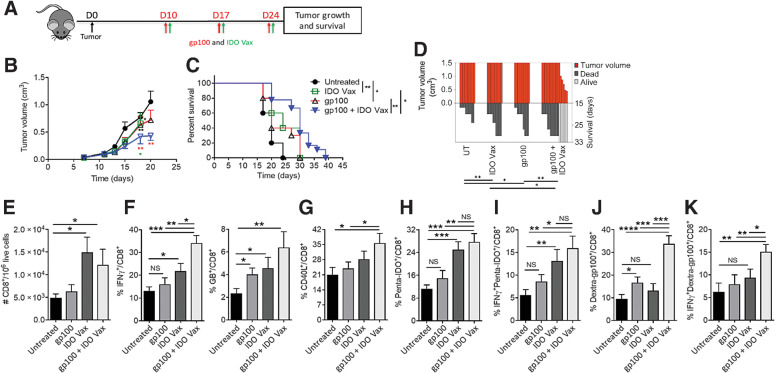
Figure 1. IDO vaccine enhances immune-mediated antitumor effects of tumor antigen–specific vaccination and prolongs survival in the B16F10 tumor model. Gating strategy and IDO pentamer specificity in Supplementary Fig. S2. A, Schematic of the treatment schedule in the tumor model. On day 10 of tumor growth, B16F10 tumor-bearing mice were given IDO vaccine (IDO-Vax) with the gp10025–33 peptide vaccine, along with PADRE (20 μg/mouse) and QuilA (10 μg/mouse) subcutaneously, every 7 days for a total of three doses. Tumor growth and survival were measured. B, Average tumor volume in mice following treatment (* vs. untreated; * vs. IDO-Vax; * vs. gp100). C, Percent survival of mice depicted by the Kaplan–Meier plot. D, SK plot showing tumor volume and survival for each mouse at different days. Data are shown as an average of two independent experiments (n = 10–18 per group). Error bars indicate the SEM. For tumor growth, statistical analysis was performed by unpaired, one-tailed Student t test. Survival in various groups was compared using log-rank (Mantel–Cox) tests. s.c., subcutaneous; *, P ≤ 0.05; and **, P ≤ 0.01. E–K, C57BL/6J mice (n = 5–8 per group) were treated as in A, except 3 days after second vaccination, mice were sacrificed, and tumors were harvested for immune response study. The frequency of B16F10 tumor-infiltrating cells was determined. Total (E), IFNγ+ and GB+ (F), CD40L+ (G), Penta-IDO+ (H), IFNγ+penta-IDO+ (I), Dextra-gp100+ (J), IFNγ+dextra-gp100+ CD8+ T (K) cells were measured by flow cytometry. Data are shown from one representative experiment of two independent experiments. Error bars indicate the SEM. Statistical analysis was performed by unpaired, one-tailed Student t test. NS: nonsignificant; *, P ≤ 0.05; **, P ≤ 0.01; ***, P ≤ 0.001; ****, P ≤ 0.0001.

IDO vaccine enhances immune-mediated antitumor effects of tumor antigen–specific vaccination and prolongs survival in the B16F10 tumor model. Gating strategy and IDO pentamer specificity in Supplementary Fig. S2. A, Schematic of the treatment schedule in the tumor model. On day 10 of tumor growth, B16F10 tumor-bearing mice were given IDO vaccine (IDO Vax) with the gp10025–33 peptide vaccine, along with PADRE (20 μg/mouse) and QuilA (10 μg/mouse) subcutaneously, every 7 days for a total of three doses. Tumor growth and survival were measured. B, Average tumor volume in mice following treatment (* vs. untreated; green * vs. IDO Vax; red * vs. gp100). C, Percent survival of mice depicted by the Kaplan–Meier plot. D, SK plot showing tumor volume and survival for each mouse at different days. Data are shown as an average of two independent experiments (n = 10–18 per group). Error bars indicate the SEM. For tumor growth, statistical analysis was performed by unpaired, one-tailed Student t test. Survival in various groups was compared using log-rank (Mantel–Cox) tests. *, P ≤ 0.05; and **, P ≤ 0.01. E–K, C57BL/6J mice (n = 5–8 per group) were treated as in A, except 3 days after second vaccination, mice were sacrificed, and tumors were harvested for immune response study. The frequency of B16F10 tumor-infiltrating cells was determined. Total (E), IFNγ+ and GB+ (F), CD40L+ (G), Penta-IDO+ (H), IFNγ+penta-IDO+ (I), Dextra-gp100+ (J), IFNγ+dextra-gp100+ (K) CD8+ T cells were measured by flow cytometry. Data are shown from one representative experiment of two independent experiments. Error bars indicate the SEM. Statistical analysis was performed by unpaired, one-tailed Student t test. NS: nonsignificant; *, P ≤ 0.05; **, P ≤ 0.01; ***, P ≤ 0.001; ****, P ≤ 0.0001.