. 2022 Mar 15;10(5):571–580. doi: 10.1158/2326-6066.CIR-21-0457

Figure 4.

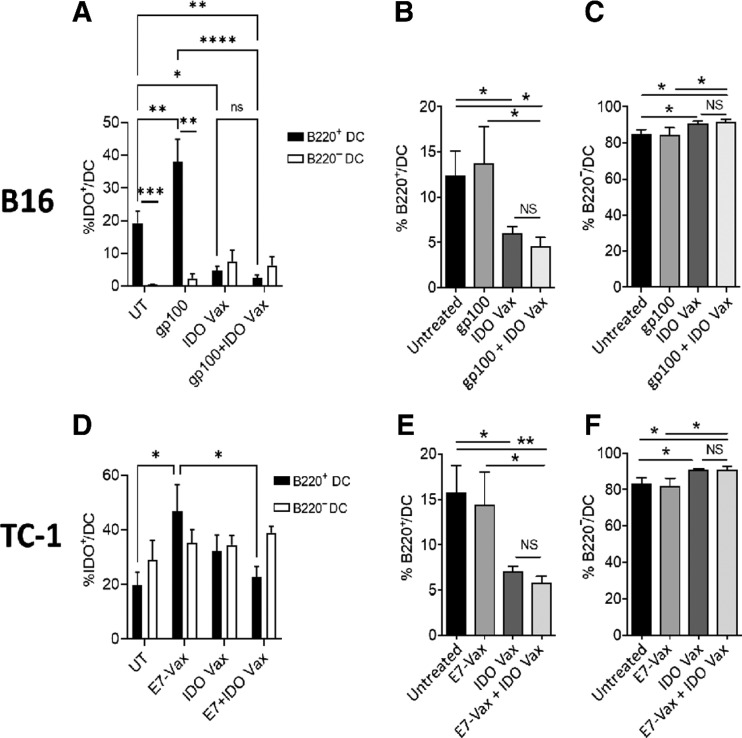
Figure 4. IDO vaccine modulates phenotypic characteristics of the myeloid population in the TME. Gating strategy in Supplementary Fig. S4. Phenotypic characteristics of myeloid populations were analyzed by flow cytometry in the B16F10 and TC-1 tumor models (see Fig. 1A and Fig. 2A, respectively, except 3 days after second vaccination, mice were sacrificed, and tumors were harvested for immune response evaluation. The frequency of B16F10 tumor-infiltrating IDO+B220+ DCs and IDO+B220− DCs (A), total B220+ DCs (B), B220− DCs (C) were determined. The frequency of TC-1 tumor-infiltrating IDO+B220+ DCs and IDO+B220− DCs (D), B220+ DCs (E), B220− DCs (F) were also assessed. Data are shown from one representative experiment (n = 4–7 per group) of two independent experiments. Error bars indicate the SEM. Statistical analysis was performed by unpaired, one-tailed Student t test. NS, nonsignificant; *, P ≤ 0.05; **, P ≤ 0.01.

IDO vaccine modulates phenotypic characteristics of the myeloid population in the TME. Gating strategy in Supplementary Fig. S4. Phenotypic characteristics of myeloid populations were analyzed by flow cytometry in the B16F10 and TC-1 tumor models (see Fig. 1A and Fig. 2A, respectively, except 3 days after second vaccination, mice were sacrificed, and tumors were harvested for immune response evaluation. The frequency of B16F10 tumor-infiltrating IDO+B220+ DCs and IDO+B220 DCs (A), total B220+ DCs (B), B220 DCs (C) were determined. The frequency of TC-1 tumor-infiltrating IDO+B220+ DCs and IDO+B220 DCs (D), B220+ DCs (E), B220 DCs (F) were also assessed. Data are shown from one representative experiment (n = 4–7 per group) of two independent experiments. Error bars indicate the SEM. Statistical analysis was performed by unpaired, one-tailed Student t test. NS, nonsignificant; *, P ≤ 0.05; **, P ≤ 0.01; ***, P ≤ 0.001.