Figure 2.
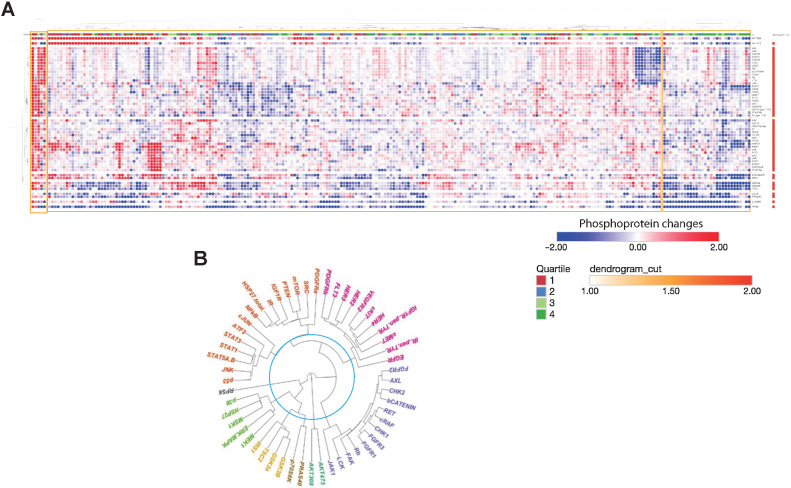
Acute dynamic phosphoproteomic perturbation. A, Hierarchically clustered heatmap showing 52 phosphoproteomic changes measures across all 35 cell lines exposed to all seven drugs, overlaid with quartiled drug sensitivity annotation, generated using Morpheus. Blue denotes a decreased phosphoprotein, and red denotes an increased phosphoprotein. Drug sensitivity quartiles are as illustrated and discussed in Fig. 3A. Clusters are highlighted with yellow boxes. B, Unrooted dendrogram representing clustering of phosphorylated proteins measured across entire dataset, showing that receptor tyrosine kinases cluster together. Colors represent distinct clusters of the dendrogram, as per slicing at the level annotated by the turquoise line.

