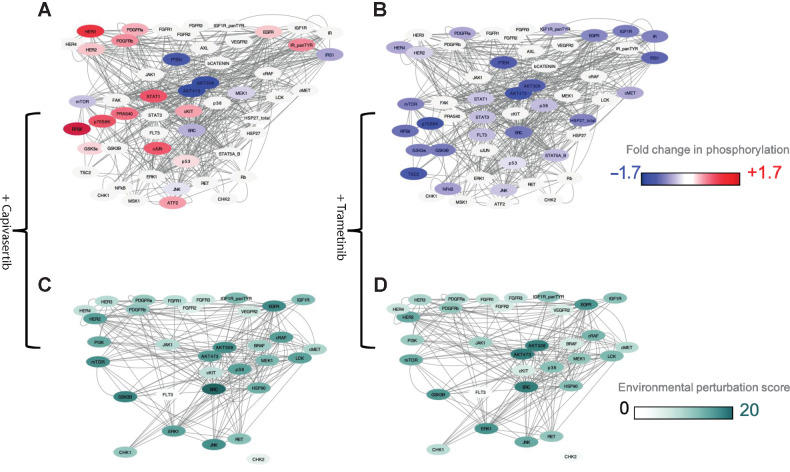
Figure 4.
Dynamic changes in phosphoproteins and EPS. Exemplar of results in a cell line HCC827. A and B, Network diagrams showing phosphoproteomic changes and drug targets with color gradient blue (−1.7) and red (+1.7). Nodes that are drug targets but where phosphorylation has not been measured are denoted in gray, that is, HSP90, PI3K, and BRAF. A, Phosphoproteomic changes related to exposure to the AKT inhibitor capivasertib. B, Phosphoproteomic changes related to exposure to the MEK inhibitor trametinib. C and D, EPS calculated for nodes that are tractable on CanSAR. C, EPS scores upon exposure to the AKT inhibition capivasertib. D, EPS scores upon exposure the MEK inhibitor trametinib.

