. 2022 Apr 3;21(6):1020–1029. doi: 10.1158/1535-7163.MCT-21-0442

Figure 5.

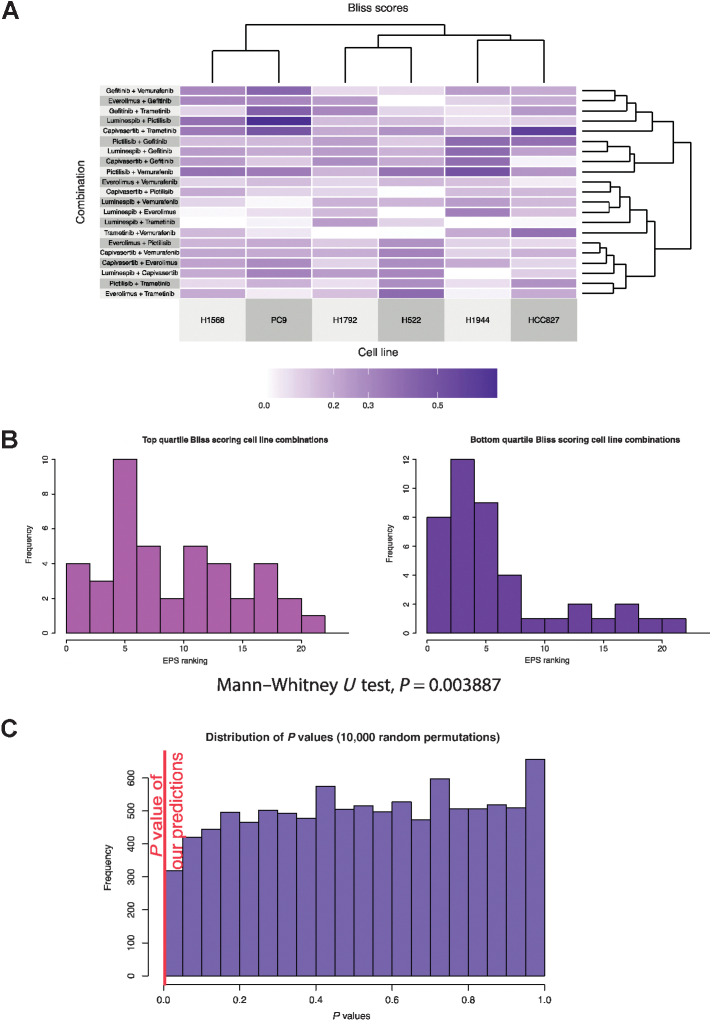
Figure 5. Experimental and predicted combinations. A, Clustered heatmap of Bliss synergy scores was experimentally measured for six cell lines treated with 21 two drug combinations. B, Histogram representing the EPS rankings of nodes of targets of drugs in the top 25% highest Bliss synergy scores, that is, “most synergistic” (left), or the EPS rankings of nodes of targets of drugs in the 25% lowest Bliss synergy scores, that is, “least synergistic,” (right). There is a significant bias toward higher EPS rankings for the most synergistic drug targets, with a significant Mann–Whitney U test P value of 0.0038875, indicating a biased distribution of rankings. C, Simulation of the Mann–Whitney U test P values obtained from 10,000-fold random permutations of EPS ranking, demonstrating the robustness of this P value.

Experimental and predicted combinations. A, Clustered heatmap of Bliss synergy scores was experimentally measured for six cell lines treated with 21 two-drug combinations. B, Histogram representing the EPS rankings of nodes of targets of drugs in the top 25% highest Bliss synergy scores, that is, “most synergistic” (left), or the EPS rankings of nodes of targets of drugs in the 25% lowest Bliss synergy scores, that is, “least synergistic” (right). There is a significant bias toward higher EPS rankings for the most synergistic drug targets, with a significant Mann–Whitney U test P value of 0.0038875, indicating a biased distribution of rankings. C, Simulation of the Mann–Whitney U test P values obtained from 10,000-fold random permutations of EPS ranking, demonstrating the robustness of this P value.