. 2022 Mar 29;20(7):1047–1060. doi: 10.1158/1541-7786.MCR-21-0477

Figure 5.

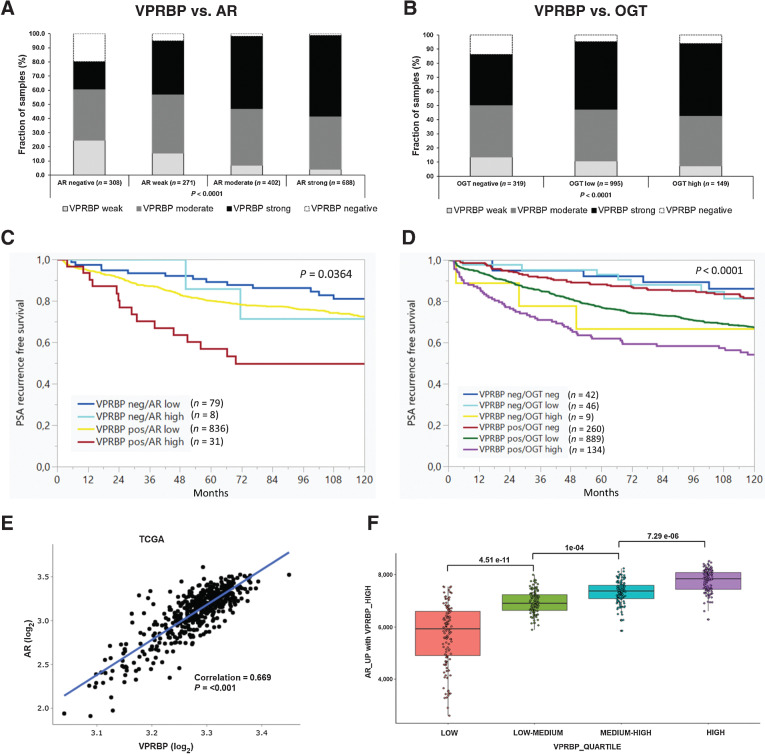
Figure 5. VPRBP protein expression correlates with AR amplification, OGT overexpression, and poor prognosis. Bar graphs showing positive correlation of VPRBP expression with AR (A) and OGT expression (B) by IHC in TMA sections. C, PSA recurrence-free survival curves in patients expressing low or high levels of AR where VPRBP expression was present or absent and survival curves (D) in patients expressing no, low or high levels of OGT where VPRBP expression was present or absent. E, Scatter plot comparing AR mRNA expression to VRPBP mRNA expression in TCGA PanCancer Atlas prostate dataset. F, Box plot showing association between VPRBP expression quartiles and the 139 upregulated AR genes from heatmap.

VPRBP protein expression correlates with AR amplification, OGT overexpression, and poor prognosis. Bar graphs showing positive correlation of VPRBP expression with AR (A) and OGT expression (B) by IHC in TMA sections. C, PSA recurrence-free survival curves in patients expressing low or high levels of AR where VPRBP expression was present or absent and survival curves (D) in patients expressing no, low or high levels of OGT where VPRBP expression was present or absent. E, Scatter plot comparing AR mRNA expression to VRPBP mRNA expression in TCGA PanCancer Atlas prostate dataset. F, Box plot showing association between VPRBP expression quartiles and the 139 upregulated AR genes from heatmap. The P-values in C and D indicate the overall significance.