Figure 1.
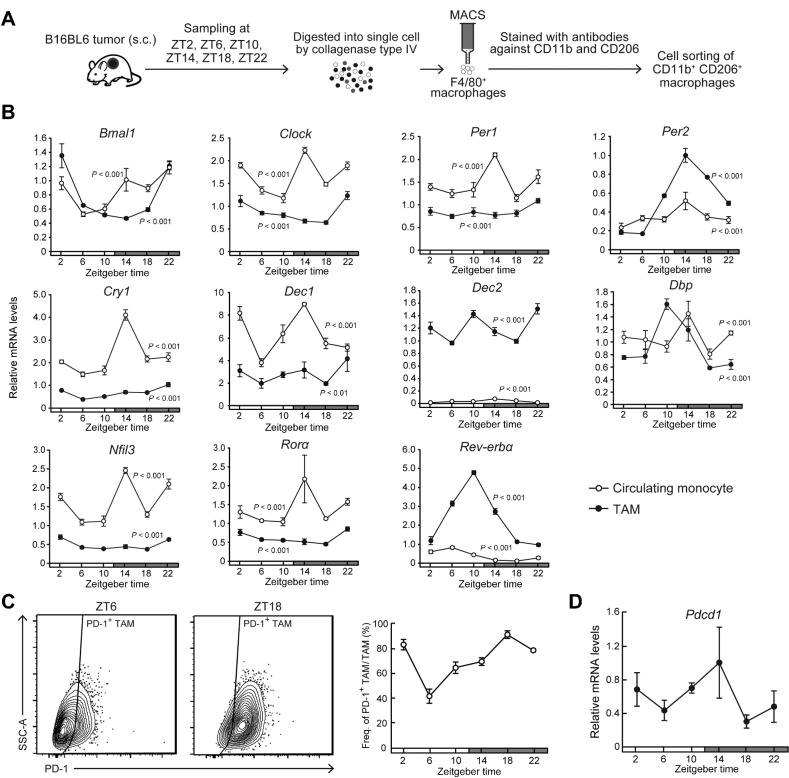
Diurnal variations in the population rate of PD-1–expressing TAMs in mouse B16/BL6 melanoma-forming tumor masses. A, Schematic depicting the isolation method of TAMs from mouse B16/BL6 melanoma-forming tumor masses. B, Temporal mRNA expression profiles of Bmal1, Clock, Per1, Per2, Cry1, Dec1, Dec2, Dbp, Nfil3, Rorα, and Rev-erbα in TAMs and circulating monocytes. Data were normalized by 18S rRNA levels. Values are the mean with SD (n = 3). There were significant time-dependent variations in the mRNA levels of all circadian clock gene in both TAMs and circulating monocytes (P < 0.01, respectively; one-way ANOVA). C, The left diagrams show the representative proportion of PD-1+ TAMs collected at ZT6 and ZT18. Right panel shows temporal profiles of the population of PD-1–expressing F4/80+ CD11b+ CD206+ TAMs. Values are the mean with SD (n = 3). There was a significant time-dependent variation in the population of PD-1–expressing TAMs. (F5,12 = 63.251, P < 0.001; one-way ANOVA). D, Temporal expression profile of Pdcd1 mRNA in TAMs. Data were normalized by 18S rRNA levels. Values are the mean with SD (n = 3). There was a significant time-dependent variation in Pdcd1 mRNA levels (F5,12 = 4.167, P = 0.020; one-way ANOVA). The horizontal bar at the bottom of each panel indicates light and dark cycles.

