. 2022 Mar 17;20(6):909–922. doi: 10.1158/1541-7786.MCR-21-0590

Figure 2.

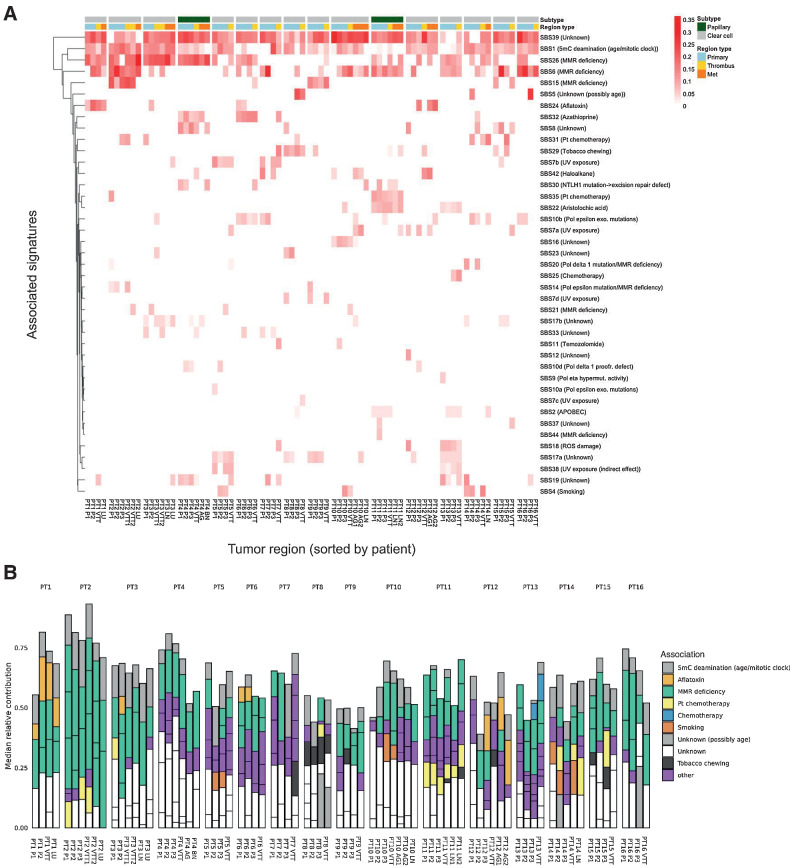
Figure 2. SNV mutational signature analysis. A, Heatmap of previously established SNV mutational signatures contributing to the mutational spectra of each tumor region across all patients. The median values of 100 bootstrap replicates are displayed. B, Contribution of previously established SNV mutational signatures to the mutational spectra of each region across all patients. Included signatures are restricted to those with a nonzero median contribution across 100 bootstrap replicates.

SNV mutational signature analysis. A, Heatmap of previously established SNV mutational signatures contributing to the mutational spectra of each tumor region across all patients. The median values of 100 bootstrap replicates are displayed. B, Contribution of previously established SNV mutational signatures to the mutational spectra of each region across all patients. Included signatures are restricted to those with a nonzero median contribution across 100 bootstrap replicates.