. 2022 Mar 17;20(6):909–922. doi: 10.1158/1541-7786.MCR-21-0590

Figure 5.

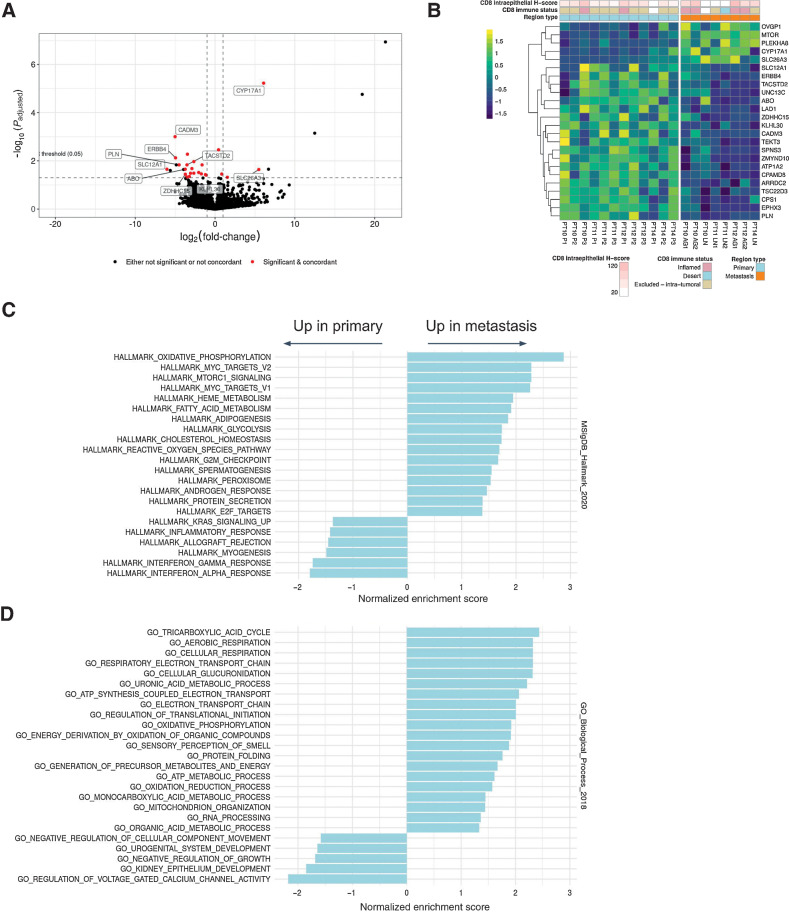
Figure 5. Differential gene expression analysis of primary tumor versus metastasis. A, Volcano plot showing log-fold changes and Padjusted values for differentially expressed genes (primary vs. metastasis). B, Heatmap showing expression values of differentially expressed genes between primary and metastatic regions. Expression values are normalized per gene and per patient. C, Significantly enriched or depleted Hallmark pathways in metastases relative to primary regions as determined by GSEA. D, Significantly enriched GO Biological Process terms enriched or depleted in metastases relative to primary regions as determined by GSEA. Significance is defined as the Padjusted value of ≤0.05 (Benjamini–Hochberg).

Differential gene expression analysis of primary tumor versus metastasis. A, Volcano plot showing log-fold changes and Padjusted values for differentially expressed genes (primary vs. metastasis). B, Heatmap showing expression values of differentially expressed genes between primary and metastatic regions. Expression values are normalized per gene and per patient. C, Significantly enriched or depleted Hallmark pathways in metastases relative to primary regions as determined by GSEA. D, Significantly enriched GO Biological Process terms enriched or depleted in metastases relative to primary regions as determined by GSEA. Significance is defined as the Padjusted value of ≤0.05 (Benjamini–Hochberg).