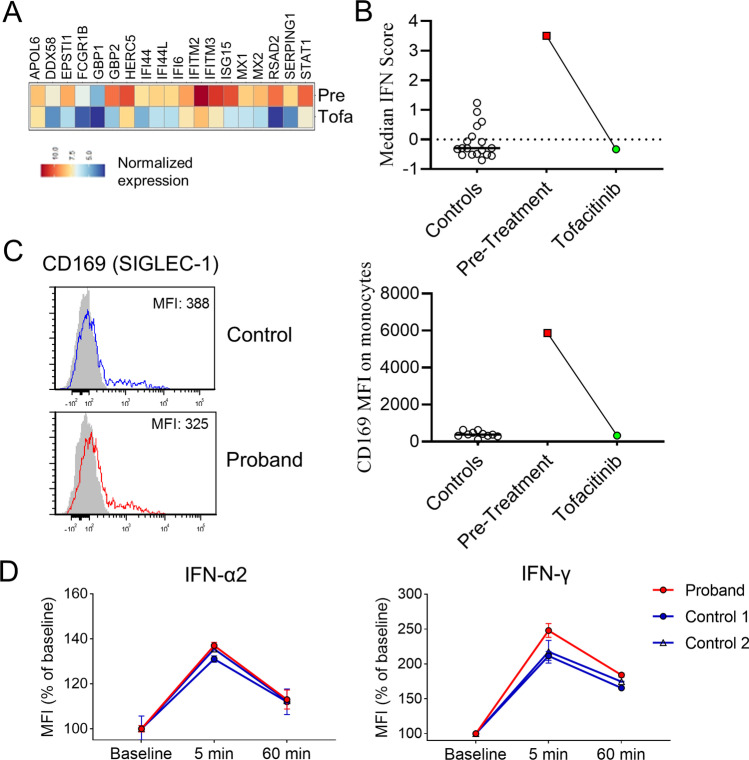
Fig. 7.
Correction of the interferon signature after treatment with the JAK inhibitor tofacitinib. (A) Heat map display of IFN-inducible gene expression in the proband’s PBMC pre- and post-treatment with tofacitinib. (B) Calculation of IFN-inducible gene score and comparison with healthy controls. (C) Flow cytometry plot (left) and comparisons of CD169 expression by MFI on monocytes. (D) Quantification of phospho-STAT1 induced by IFN-α2 and IFN-γ stimulation in CD14 + in monocytes from healthy controls (n = 2) and the proband 4 weeks after initiation of tofacitinib treatment (2 replicates each). Error bars represent standard deviation in panel (D)

