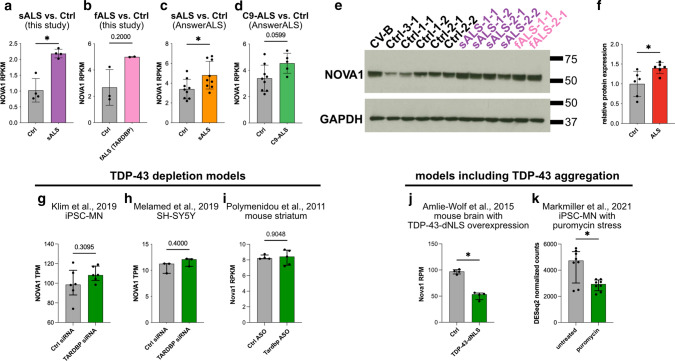
Fig. 3.
NOVA1 expression is increased in ALS iPSC-MN and elevated cytoplasmic TDP-43 levels are associated with a reduction of NOVA1 mRNA levels. a–d Bar graphs of gene expression values for NOVA1 as reads per kilobase transcript per million mapped reads (RPKM) from a sALS and Ctrl generated in this study (n = 4 sALS, n = 4 Ctrl), b fALS and Ctrl generated in this study (n = 2 fALS, n = 3 Ctrl), c sALS and Ctrl from the AnswerALS consortium dataset (n = 9 sALS, n = 9 Ctrl), and d C9-ALS and Ctrl from the AnswerALS consortium dataset (n = 5 C9-ALS, n = 9 Ctrl). Data presented as mean ±SD. Statistical significance was determined by Mann-Whitney U test. a P value = 0.0286, b P value = 0.2000, c P value = 0.0315, d P value = 0.0599. e Western blot from total cell lysates of iPSC-MNs stained for NOVA1 and GAPDH. f Bar graph showing densitometric quantification of Western blot of NOVA1 normalized to GAPDH (n = 6 ALS; n = 6 Ctrl). Fold change ALS/Ctrl: 1.42. Data presented as mean ±SD. Statistical significance was determined by Mann-Whitney U test. P value = 0.0152. g Bar plot with NOVA1 expression values (in TPM) in iPSC-MN with control siRNA or siRNA targeting TARDBP (GEO ID: GSE121569; n = 6 control siRNA, n = 6 TARDBP siRNA). Data presented as median +IQR. Statistical significance was determined by Mann-Whitney U test. P value = 0.3095. h Bar plot with NOVA1 expression values (in TPM) in SH-SY5Y with control siRNA or siRNA targeting TARDBP (GEO ID: GSE122069; n = 3 control siRNA, n = 3 TARDBP siRNA). Data presented as median +IQR. Statistical significance was determined by Mann-Whitney U test. P value = 0.4000. i Bar plot with NOVA1 expression values (in RPKM) in mouse striatum with control ASO or ASO targeting TARDBP (GEO ID: GSE27394; n = 4 control ASO, n = 5 TARDBP ASO). Data presented as median +IQR. Statistical significance was determined by Mann-Whitney U test. P value = 0.9048. j Bar plot with NOVA1 expression values (in RPM) in mouse brain without and with TDP-43-dNLS expression (GEO ID: GSE65973; n = 4 Ctrl, n = 4 TDP-43-dNLS). Data presented as median +IQR. Statistical significance was determined by Mann-Whitney U test. P value = 0.0286. k Bar plot with NOVA1 expression values (in DESeq2 normalized counts) in iPSC-MN (4 Ctrl, 4 HNRNPA2B1 mutant lines) without and with puromycin stress (GEO ID: GSE157467; n = 8 untreated, n = 8 puromycin). Data presented as median +IQR. Statistical significance was determined by Mann-Whitney U test. P value = 0.0379

