Fig. 6.
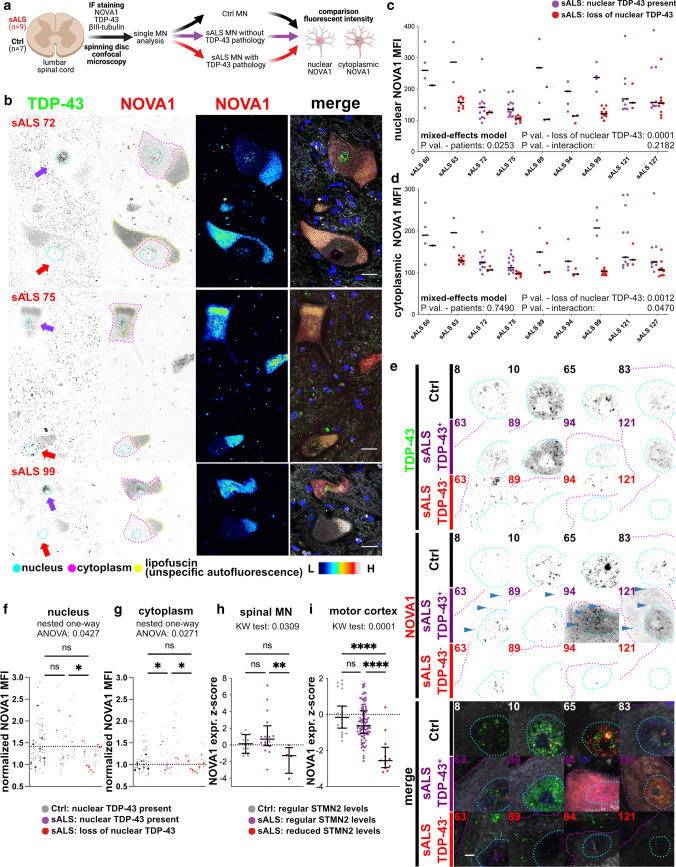
NOVA1 expression in postmortem MN in lumbar spinal cord from ALS and Ctrl a Schematic illustrating the basic analysis strategy for NOVA1 expression in human tissue. We performed IF staining, spinning disc confocal microscopy and subsequent analysis of single MNs for NOVA1 mean fluorescent intensity and TDP-43 pathology in n = 7 Ctrl and n = 9 sALS. b Representative images of MN with nuclear TDP-43 (no TDP-43 pathology, purple arrow) and without nuclear TDP-43 (with TDP-43 pathology, red arrow) in sALS patients. Pictures stained for TDP-43 (green), NOVA1 (red), bIII-tubulin (gray) and DAPI (blue). Nuclear (cyan), cytoplasmic (fuchsia) and lipofuscin (yellow) areas analyzed are surrounded. Scale bars: 25µm. c Scatter plot of mean nuclear NOVA1 staining intensities in individual MNs from different ALS patients without (purple) and with (red) TDP-43 pathology. Horizontal black lines represent medians. Statistical analysis was performed using a mixed effects model. d Scatter plot of mean cytoplasmic NOVA1 intensity in individual MNs from different ALS patients without (purple) and with (red) TDP-43 pathology. Horizontal black lines represent medians. Statistical analysis was performed using a mixed effects model. e Representative immunofluorescence images of MNs in lumbar spinal cord from control individuals (black) and from sALS patients without (purple) and with TDP-43 pathology (red). Sections were stained for TDP-43 (green), NOVA1 (red), bIII-tubulin (gray) and DAPI (blue). Nuclear (cyan) and cytoplasmic (fuchsia) areas analyzed are surrounded. Blue arrowheads indicate cytoplasmic NOVA1 accumulations. Scale bar: 25µm. f Scatter plot of bIII-tubulin normalized mean nuclear NOVA1 staining intensities of single MNs (dots) their average in an individual (line). Dashed line represents median in Ctrl. Statistical significance was determined by nested one-way ANOVA. *P value < 0.05; **P value < 0.01; ***P value < 0.001; ****P value < 0.0001. Significant variation between individuals within a group: P value = 0.0001. g Scatter plot of bIII-tubulin normalized mean cytoplasmic NOVA1 intensities of single MN (dots) their average in an individual (line). Dashed line represents median in Ctrl. Statistical significance was determined by nested one-way ANOVA. *P value < 0.05; **P value < 0.01; ***P value < 0.001; ****P value < 0.0001. Significant variation between individuals within a group: P value > 0.05. h Scatter plot illustrating NOVA1 expression converted into expression Z-scores based on control means from postmortem ALS LCM datasets from [32] and [55] in Ctrl (black), sALS samples with regular STMN2 levels (STMN2 expression Z-score > −2, purple) and sALS samples with reduced STMN2 levels (STMN2 expression Z-score < −2, red). Black horizontal lines indicate median and interquartile ranges. Statistical significance was determined by Kruskal-Wallis test and Dunn's post hoc test to identify changes between individual groups. *P value < 0.05; **P value < 0.01; ***P value < 0.001; ****P value < 0.0001 i Scatter plot illustrating NOVA1 expression converted into expression Z-scores based on Ctrl means from postmortem ALS motor cortex datasets from UCSD and NYGC cohorts [63] in Ctrl samples (black), sALS samples with regular STMN2 levels (STMN2 expression Z-score > −2, purple), and sALS samples with reduced STMN2 levels (STMN2 expression Z-score < −2, red). Black horizontal lines illustrate median and interquartile ranges. Statistical significance was determined by Kruskal-Wallis test and Dunn's post hoc test to identify changes between individual groups. *P value < 0.05; **P value < 0.01; ***P value < 0.001; ****P value < 0.0001

