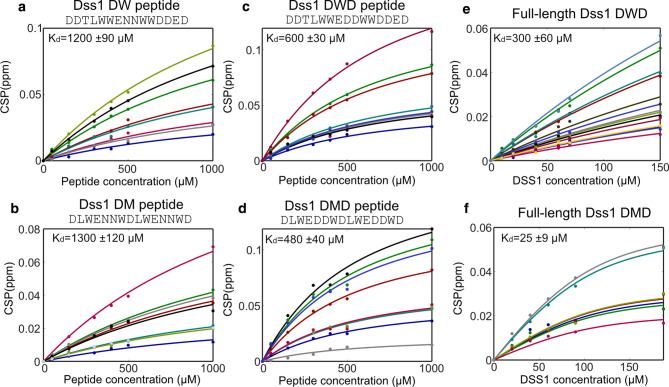
Fig. 4.
Increased affinity for ubiquitin by aromatics, negative charge and chain context. Changes in CSP with the concentrations of peptide or protein. Each fit line and corresponding colored data points reflect the CSPs of individual NMR signals from 1H-15 N-HSQC spectra of 100 µM 15 N-labeled ubiquitin upon titration with either peptides (a–d) or proteins (e and f). Peptide and protein names are shown at the top. All data points in one titration were fitted using a global fit to obtain the Kd values reported on each plot

