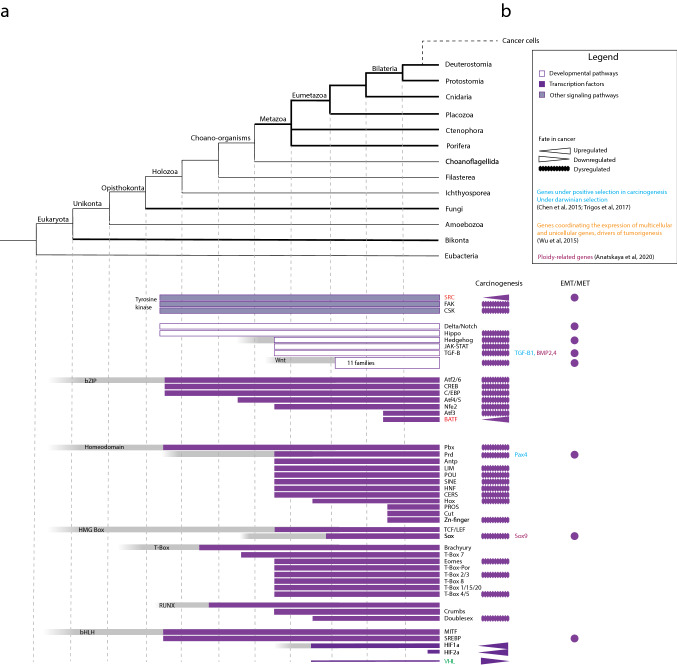
Fig. 4.
Cladogram representing the evolution of the genetic toolkit for cell differentiation, organogenesis, and multicellular development in animals (a). Bars represent the presence of the corresponding protein or protein family based on genome comparisons. The fate of these toolkits in cancer is also marked, as upregulated, downregulated, or dysregulated, and families that include genes involved in EMT/MET are indicated (b). Proto-oncogenes (red) and tumor suppressors (green) are marked (Color figure online)

