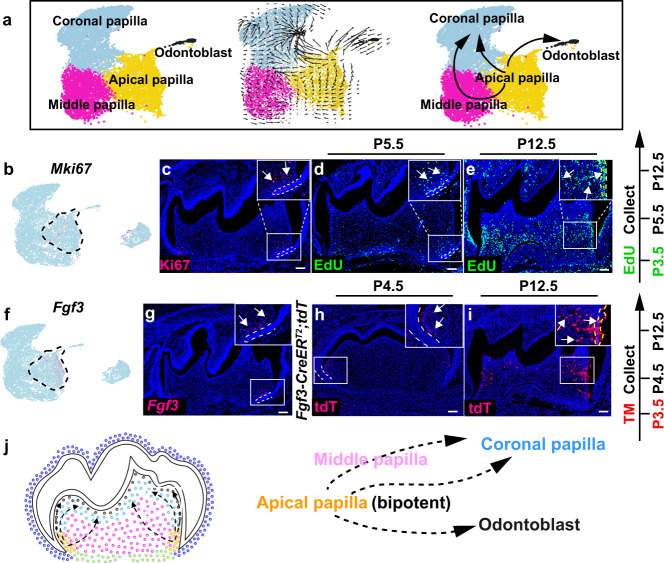
Fig. 5. Apical papilla cells are bipotent progenitor cells that give rise to dental pulp cells and odontoblasts in the mouse molar.
a Velocity analysis of dental papilla cell populations in the mouse molar at P3.5. b, c Feature plot of Mki67 and immunostaining of Ki67 in the mouse molar at P3.5 (n = 3). d, e EdU tracing analysis in the mouse molar from P3.5 to P12.5 (n = 3). f, g Feature plot and RNAscope staining of Fgf3 in the mouse molar at P3.5 (n = 3). h, i Lineage tracing analysis of Fgf3+ cells in the mouse molar from P3.5 to P12.5 (n = 3). j Differentiation trajectory of dental papilla cells in the mouse molar at P3.5. White boxes are magnified in the inserts of the figures. Black dotted lines outline the cellular domains in the feature plots and white dotted lines outline the dental epithelial cells in the mouse molar. Yellow dotted lines in e and i outline the odontoblast layer in the mouse molar. White arrows point to the positive signals and black arrows indicate the differentiation trajectory. EdU and tamoxifen injection protocols are on the right side of the figures. Scale bars, 100 μm.

