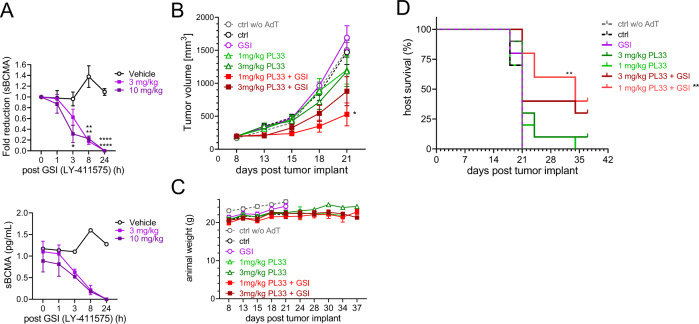
Fig. 7. GSI rapidly and effectively cleared sBCMA released from MM tumors in mouse serum and further improved in vivo anti-MM activity of BCMAxCD3 BisAb with extended host survival.
A NSG mice were inoculated with KMS11-luc cells subcutaneously on the right flank at d0 and administered a single dose of GSI (3 (light purple square) and 10 (dark purple square) mg/kg LY-411575), or vehicle treated control (black open circle) when tumor volume reached ~325 mm3. Serum was serially collected following indicated time periods to evaluate sBCMA levels. Shown are fold reduction in sBCMA from baseline (time 0) (upper panel) and sBCMA pg/mL (lower panel). Data are presented as means ± SEMs (error bars). B–D NSG mice were injected with PBMCs (AdT) 5 days prior to KMS11-luc cell implantation on d0 and mice were randomized into their respective groups on d8 when average tumor size was ~200 mm3. LY-411575 (3 mg/kg, QDx2) was administered PO as a single agent GSI and in combination groups. On the following day (d9), the second dose of LY41175 was administered followed by a single dose of PL33 to the single agent PL33 groups and combination groups at a dose 1 or 3 mg/kg IV. Cohorts included: 3 mg/kg LY-411575 (purple circle), 3.0 mg/kg (dark green triangle) or 1.0 mg/kg (light green triangle) PL33, LY-411575 + 3 mg/kg PL33 (maroon solid square) LY-411575 + 1 mg/kg PL33 (red solid square), tumor only (ctrl, black circle), tumor without PBMCs (ctrl w/o AdT, gray circle). B Shown are mean tumor volumes (mm3) ± SDs (error bars) at following days vs. start of treatment. *P < 0.05 for tumor growth inhibition of single agent and combination treatments (one-way ANOVA followed by Tukey’s multiple comparison test and unpaired t-test between single agent PL33 compared to combination. C Weights of mice were followed. D Conditional survival plot with time to endpoint set when tumor burden (TB) reached ~1200 mm3. Kaplan–Meier and log-rank (Mantal–Cox) analysis followed by multiple comparison tests (Holm–Sidak method) was used to estimate median overall survival of animals (1 mg/kg PL33 with GSI, 34 days; the other 6 groups, 21 days) (P < 0.01). *P < 0.05, **P < 0.01, ***P < 0.001, ****P < 0.0001.

