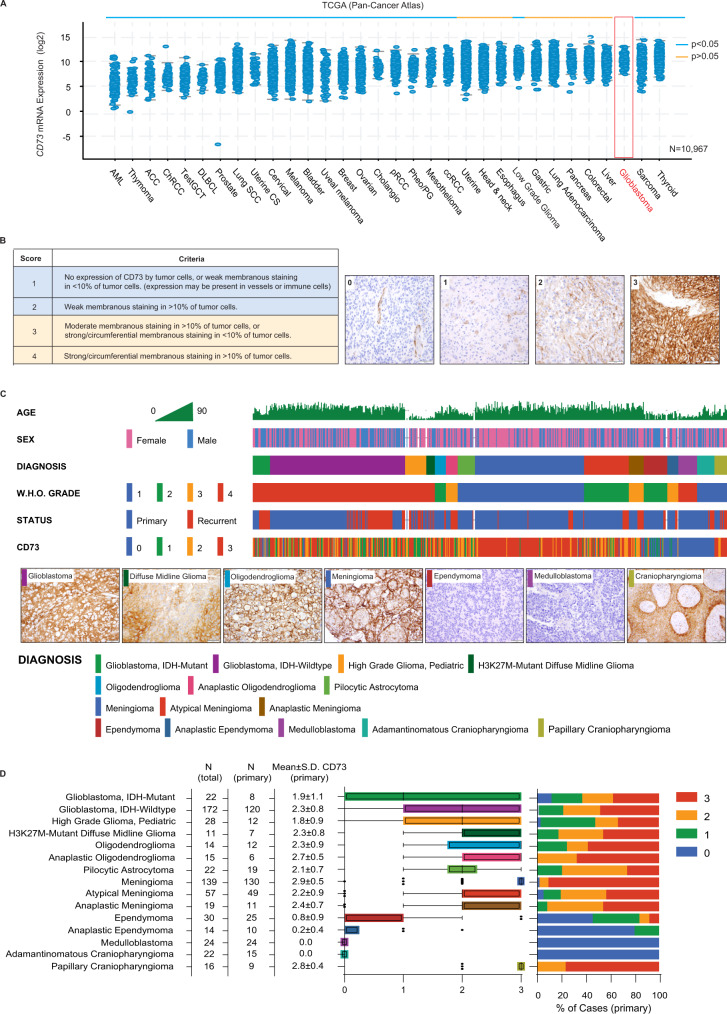
Fig. 4. CD73 exhibits distinctive expression patterns in glioblastoma and other central nervous system tumors.
A Bulk CD73 mRNA expression was assessed in tumor tissue (n = 10,967) from 32 cancer subtypes (TCGA). Glioblastoma (red box) exhibited significantly higher CD73 expression (p < 0.05, blue bar, t-test, unpaired, two-sided, with Welch’s correction; see Supplementary Data 3 for precise values) relative to most tumor sub-types. B CD73 immunohistochemistry was performed on a cohort of 605 independent human CNS tumors from the BWH archives and Children’s Brain Tumor Tissue Consortium (CBTTC), including each major subtype and multiple tumors which have not been systematically evaluated for CD73 expression previously (oligodendroglioma, meningioma, ependymoma, craniopharyngioma, medulloblastoma, pediatric glioma). Each tumor in the larger cohort was stained once. Following qualitative evaluation of the specimens by a pathologist, semi-quantitative (0–3) immunohistochemistry (IHC) index scoring criteria were defined to characterize and compare membranous CD73 protein expression in these tumors (representative staining for each score in glioblastoma specimens are depicted in the right-panels); scale bars 50 µm. C This scoring system was then applied to the full cohort of 604 CNS tumors, demonstrating distinct expression patterns in each histologic subtype (representative staining from cases of major subtypes are demonstrated); scale bars 50 µm (except for craniopharyngioma 100μm). D IDH-mutant [n = 22] and IDH-wildtype [n = 172] adult glioblastomas, H3K27M-mutant diffuse midline glioma [n = 11] and pediatric high-grade glioma [n = 28], pilocytic astrocytomas [n = 22], and oligodendrogliomas [n = 29] frequently exhibited strong (IHC ≥ 2) CD73 expression. Medulloblastomas of all histologic and molecular subtypes [n = 24] and ependymomas [n = 44], exhibited minimal CD73 expression. Adamantinomatous craniopharyngiomas exhibited no CD73 expression in the tumor epithelium but consistently strong expression in peri-tumoral fibrovascular stroma [n = 22], while papillary craniopharyngiomas exhibited strong epithelial/tumor CD73 expression in all cases [n = 16]; middle panel uses a Tukey box-and-whisker plot with midline = median, box limits = Q1 (25th percentile)/Q3 (75th percentile), whiskers = 1.5 inter-quartile range (IQR), dots = outliers (>1.5IQR)).

