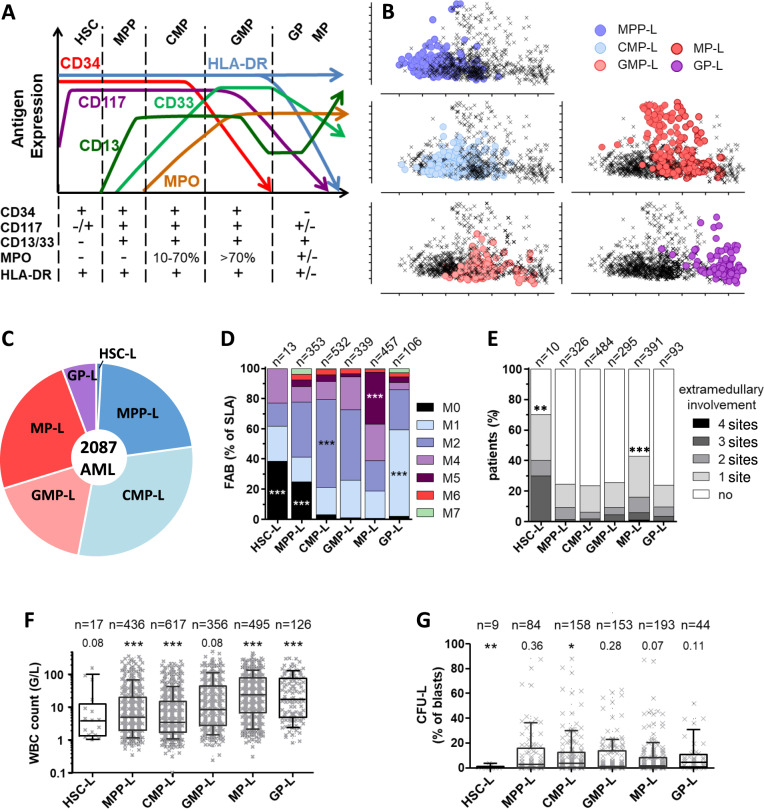
Fig. 1. Phenotypic and clinical identification of AML subgroups.
A Model of the relative percentage of myeloid marker expression over the course of normal HSPC differentiation. The SLA is defined by the combination of expressions of five myeloid markers plus HLA-DR to differentiate GP-L (HLA-DR+) and MP-L (HLA-DR−); +≥20% of blasts; −<20% of blasts; +/− marker can be positive or negative. B Principal component analyses of 945 AML using the percentage of AML blasts expression of 16 markers by flow cytometry (CD4, CD7, CD13, CD33, CD117, MPOc, CD34, HLA-DR, CD56, CD64, CD38, CD65, CD16, CD14, CD11b, CD123). AML patients were classified according to their SLA as detailed in (A). C Pie chart of 2087 AML from TUH cohort segregated according to their SLA. D FAB classification according to SLA in the TUH cohort. Fisher’s exact test compared FAB classification in one SLA to all others. E Extramedullary involvement in SLA (see Table 1 for details). F Boxplots of leukocytosis at diagnosis in TUH cohort. G CFU-L in TUH cohort. Statistical analysis was performed comparing one SLA to all others (Mann–Whitney test).

