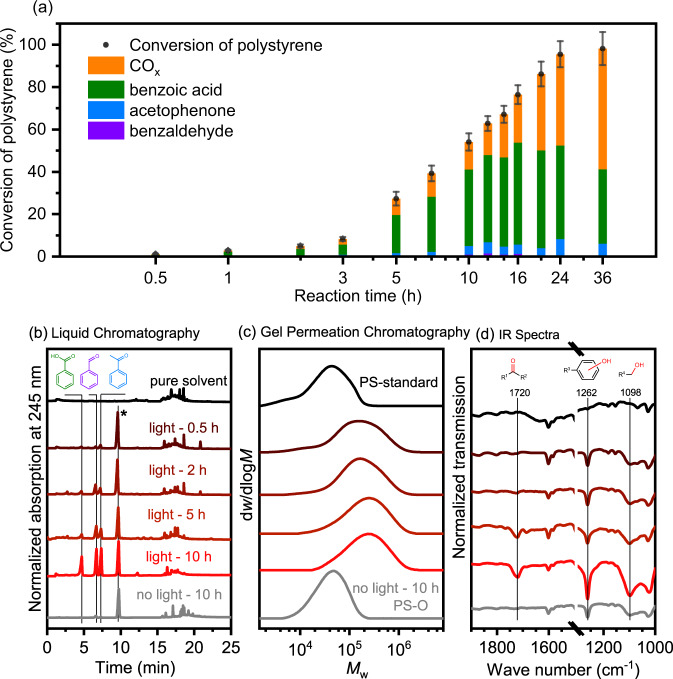
Fig. 1. Analysis of product and PS reactant in different reaction stages.
a Time-evolution of different products for polystyrene photocatalytic oxidation reaction at 150 °C under 10 bar O2, 50 mg g-C3N4, 10 mg polystyrene (Mw ~ 50 kDa), 30 mL acetonitrile, 300 W Xenon lamp. Distribution of different products are shown by column with different colors. The error bars represent the standard deviation of conversion in 3 parallel experiments. b Liquid chromatograms of reaction solutions with different time and conditions. The first line pure solvent refers to the signal of pure solvent. The peaks marked with an asterisk represent the nitrobenzene internal standard. c Molecular weight distribution measured by Gel Permeation Chromatography (GPC) and d the Infrared (IR) transmission spectra of the polystyrene reactant and the recovered polystyrene after reactions with light irradiation for 0.5 h, 2 h, 5 h, and 10 h and without light irradiation for 10 h. The corresponding spectral order in d is consistent with that in c. Source data are provided as a Source Data file.

