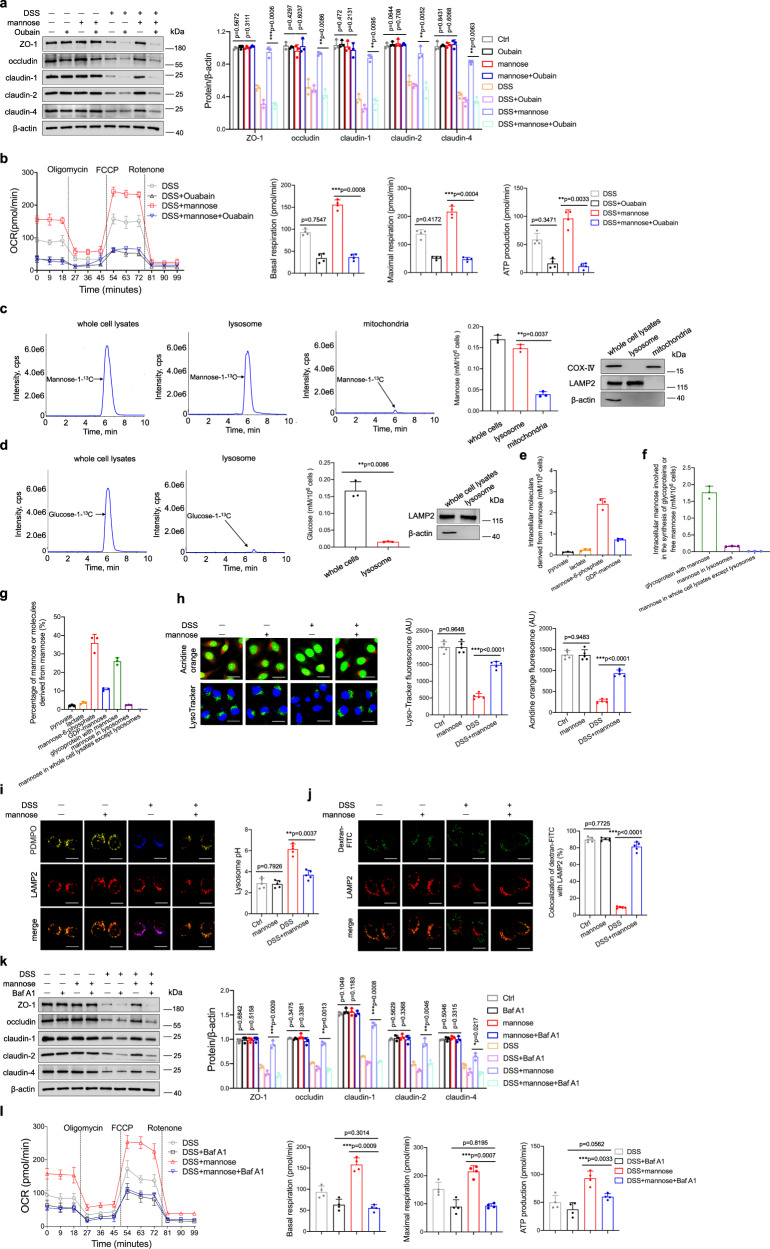
Fig. 5. Mannose rescues the alterations in epithelial cell lysosomal integrity induced by DSS.
a, b NCM460 cells were pretreated with ouabain (1 μM) for 4 h, followed by DSS and mannose administration. a The protein levels of the tight junction were evaluated by immunoblotting analysis. b Seahorse analysis of OCR in the cells is presented. The OCR of basal and maximal mitochondrial respiration, as well as ATP production, were analyzed. c, d NCM460 cells were incubated with 25 mM mannose-1-13C or glucose-1-13C for 24 h, respectively. c The amount of mannose in the lysosomal, mitochondrial fraction, and the whole cell lysates were determined by LC–MS/MS analysis. d The amount of glucose in the lysosomal fraction and the whole cell lysates were determined. The markers of isolated lysosomal fraction and mitochondrial fraction were evaluated by immunoblotting analysis. e–g NCM460 cells were incubated with 25 mM mannose-1-13C for 24 h. e The amount of mannose-1-13C derived molecules was detected by LC–MS analysis. f The amount of mannose-1-13C involved in glycoproteins and free mannose was detected. g The percentage of mannose-1-13C derived molecules, mannose involved in glycoproteins, and free mannose was calculated. h, i NCM460 cells were stimulated with DSS with or without mannose for 24 h, followed by acridine orange (Scale bar = 20 μm) (h). Lysosomal acidification was assessed by PDMPO staining. Scale bar = 20 μm (i). Fluorescence analysis of lysosomal integrity using FITC-conjugated dextran. Scale bar = 20 μm (j). Fluorescence intensity was analyzed by ImageJ software. k, l NCM460 cells were cultured with DSS and mannose for 24 h with or without bafilomycin A1 (1 μM), the expression of the tight junction was determined by immunoblotting analysis (k). Seahorse analysis of OCR in the cells is presented. The basal and maximal mitochondrial respiration, as well as ATP production were analyzed (l). **p < 0.01, ***p < 0.001. Data from one representative experiment of three independent experiments are presented. Two-side, unpaired t-test for (a–d, h–l). Source data are provided as a Source Data file.

