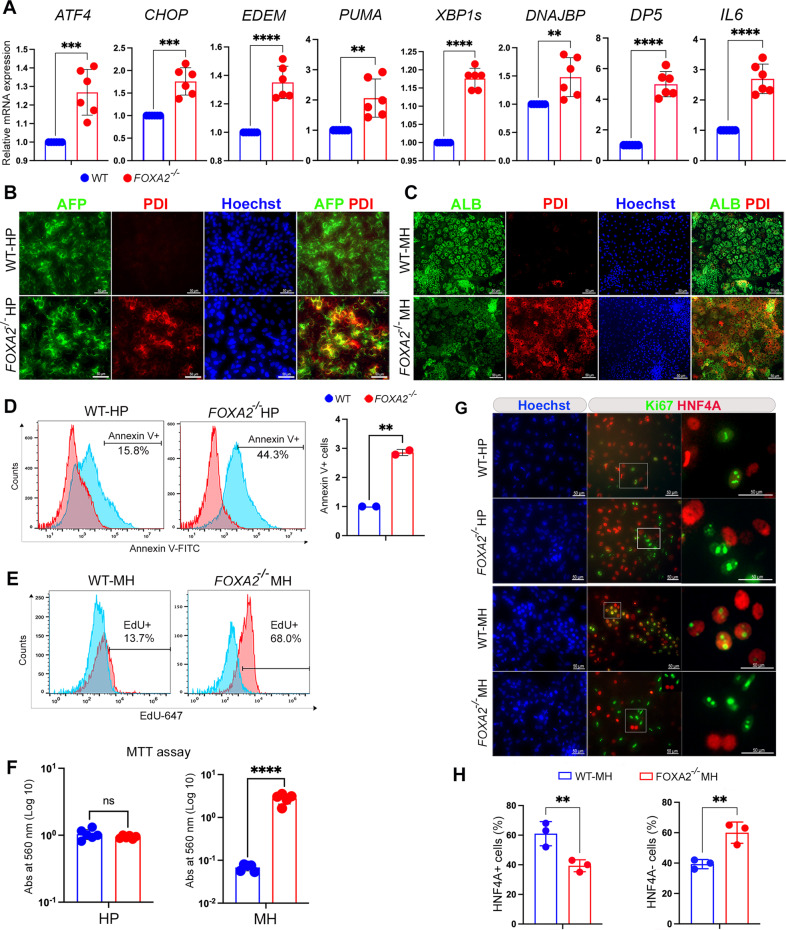
Fig. 3. Effect of FOXA2 ablation on ER-stress markers, apoptosis, and proliferation in iPSC-derived hepatocytes.
A RT-qPCR analysis showing the expression of ER stress genes, ATF4, CHOP, EDEM, PUMA, XBP1s, DNAJBP, DP5, and IL6 in hepatic progenitors (HP) derived from FOXA2−/−iPSCs and WT controls (n = 6). B Immunofluorescence showing co-expression of ER stress marker, PDI, with AFP in FOXA2−/−HP (B) and with ALB in FOXA2−/−MH (C) compared to WT controls. D Flow cytometry analysis of cell apoptosis (Annexin V + cells) showing a significant increase in apoptosis in HP derived from FOXA2−/−iPSCs compared to those derived from WT-iPSCs (n = 2). E Flow cytometry analysis of EdU incorporation showing a dramatic increase in cell proliferation (EdU + cells) in mature hepatocytes (MH) derived from FOXA2−/−iPSCs in comparision to those derived from WT-iPSCs (n = 3). F Relative MTT levels in FOXA2−/− HP and FOXA2−/− MH relative to WT controls, quantified by measuring absorbance at 560 nm (n = 5). G Double immunofluorescence staining for Ki67 (proliferation marker) and HNF4A (hepatic marker) in FOXA2−/−HP and FOXA2−/−MH relative to WT controls. Squares indicate cells magnified in the right panels. Note clear distinction between Ki67 and HNF4A in HP and MH lacking FOXA2. H Percentage of HNF4A+ (hepatocytes) and HNF4A− (non-hepatocytes) cells in FOXA2−/− MH compared to WT controls. The total number of cells was determined using Hoechst staining (n = 3). The data are presented as mean ± SD. *p < 0.05, **p < 0.01, ***p < 0.001.

