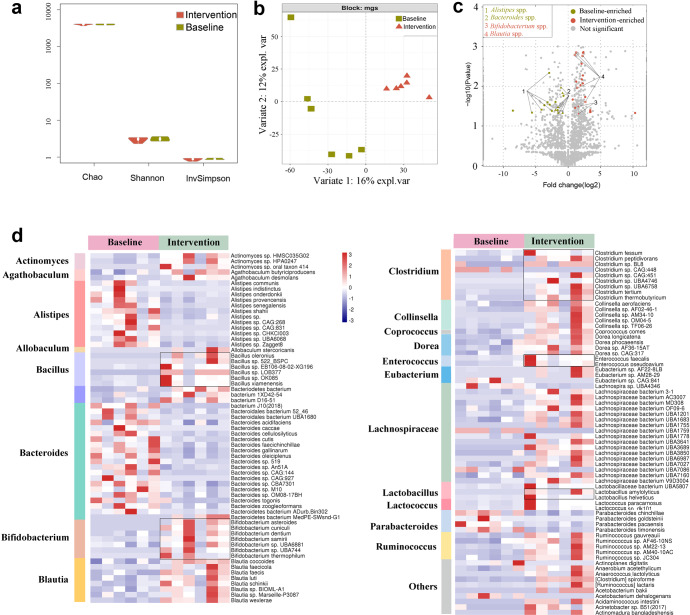
Fig. 3. Probiotic yogurt significantly altered the symbiosis of gut microbiota after 12 weeks of intervention.
a No significant differences were noted in bacterial α-diversity values between the two groups. b Bacterial signatures between the two groups varied significantly (Bray–Curtis distance, PERMANOVA, p = 0.025), as shown using DIABLO. c Signatures of gut microbiota in the baseline and intervention groups. The x-axis shows the fold change of a species abundance of the two groups. The y-axis shows the −log10 (p value) of each species in the two groups. Species with significant difference in abundance between the two groups are shown in green (baseline-enriched) and red (intervention-enriched); species belonging to the same genus are linked by lines. Species with no significant difference in abundance between the two groups are shown in gray. Metastats was used to determine MGS signatures. d The heatmap shows the prominent species that differed significantly in abundance between the baseline and intervention groups. Red indicates enrichment and blue decrease. The magnitude of the changes is proportional to the color intensity. n = 6 in each group. Wilcoxon rank-sum test was performed. Source data and exact p values are provided in the source data file.

