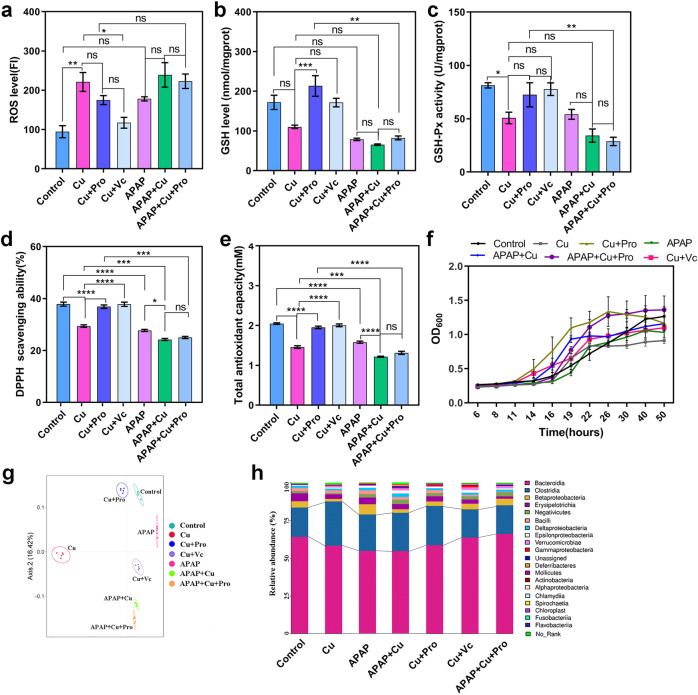
Fig. 8. Probiotic strain GR-1 alleviated OS and altered the composition of GM in mice.
The OS status (a ROS level, b GSH level, and c GSH-Px activity) and antioxidant activity (d DPPH free radical–scavenging ability and e the total antioxidant capacity) of intestinal contents with different treatments. f The growth curve of GM in BGM growth medium containing 50 mg/L Cu under anaerobic condition. g PCA analysis of β-diversity in GM structures among the seven groups based on the Bray–Curtis distance. h The average relative abundances of GM at the class level. Data are expressed as means ± standard errors of the means in figure a–f. n = 3 per group in figure a–f and n = 5 per group in figure g and h. a–e statistical analysis was performed using one-way ANOVA with Tukey’s post hoc analysis (*p < 0.05, **p < 0.01, ***p < 0.001, and ****p < 0.0001, ns represents not significant) using GraphPad Prism (version 8.0.1). Source data are provided as a source data file.

