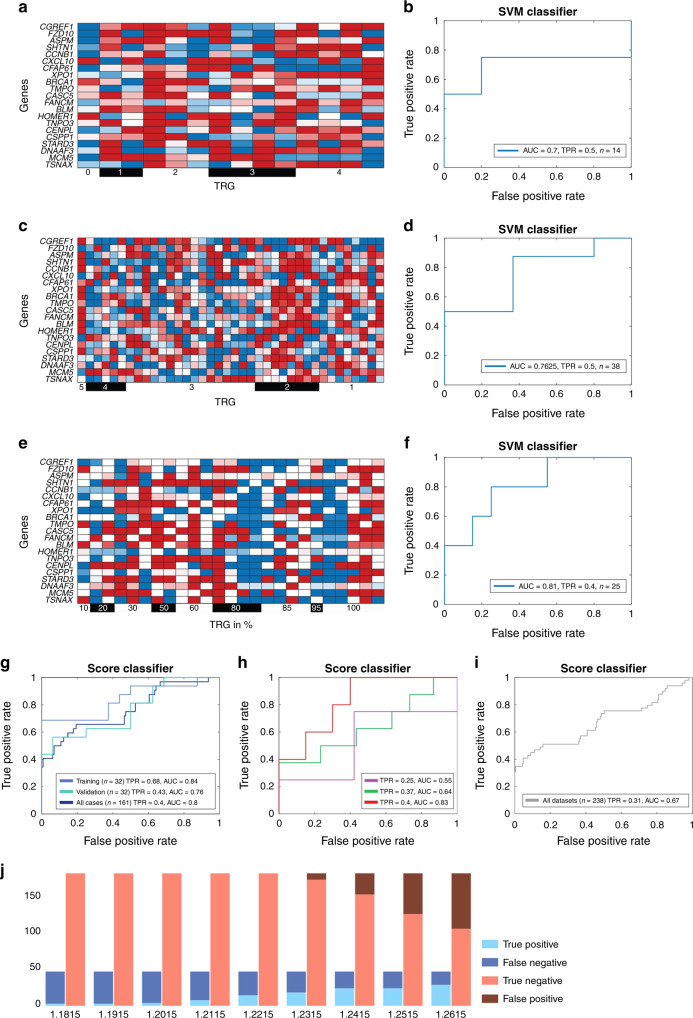
Fig. 2. The SVM classifier and the score classifier robustly predict pathological complete response in three independent patient cohorts, while never misclassifying a partial responder as complete.
a Heatmap visualisation and b ROC curve of the SVM-classifier performance 14 patients from the CAO/ARO/AIO-94 or 04 trial, not examined in the first analysis. Two out of 4 patients with pCR were identified. c Heatmap visualisation and d ROC curve of SVM-classifier performance for 38 patients published by Millino et al. [31]. Four out of 8 patients with pCR were identified. e Visualisation and f ROC curve of SVM-classifier performance when applied to 25 prospectively collected specimens from the TransValidA trial. Two out of 5 patients with pCR were identified. g The score-classifier performance for the training, validation and all 161 cases, with a full range of tumour regression grading in percent. h ROC curve of the score-classifier performance for 14 patients from the CAO/ARO/AIO-94 or 04 trial (purple, one out of 4 patients with pCR were identified), for 38 patients published by Millino et al. [31] (three out of 8 patients with pCR were identified) and for the 25 prospectively collected specimens from the TransValidA trial (red, two out of 5 patients with pCR were identified). i ROC curve of the score-classifier performance for the integration of all 238 samples in this study. j Bar plots showing the prediction accuracy and error types for different score thresholds on the aggregate compendium of the 238 patients included in all datasets studied (161 + 14 patients from the CAO/ARO/AIO-94 or -04 trial, 38 cases published by Millino et al. [31], 25 patients included in the TransValidA trial).

