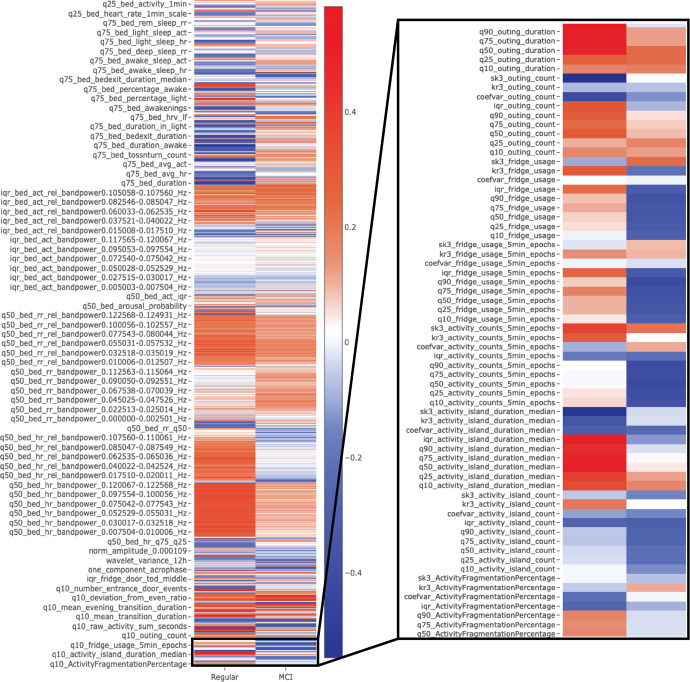
Fig. 1. Exemplary visualizations of averaged digital exhausts.
Depicts an example of z-normalised, averaged digital exhausts of participants with mild cognitive impairment (MCI) (based on a Montreal Cognitive Assessment screening < 23 points). Digital measures > 0 (in blue) indicate above-average values for that group, while < 0 (red) indicates below-average values. Many digital measures visually differ in both examples. It should be noted that this is a down-scaled visualisation, as not all measures would fit in the figure. For the complete and interactive version, see the supplementary online version (Note the zoom-in functionality).

