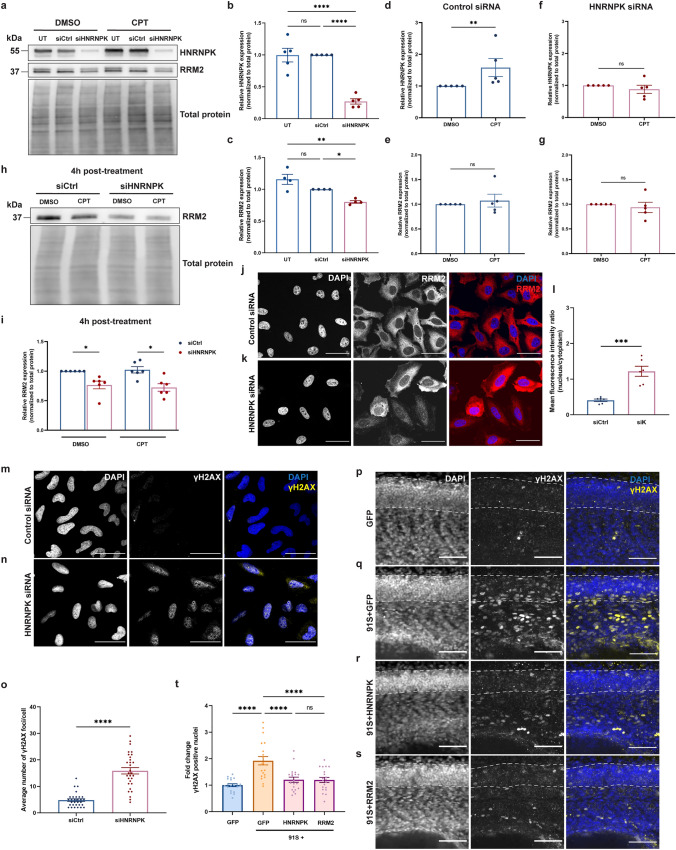
Fig. 6.
HNRNPK and RRM2 are implicated in the DNA damage response in C9 RNA toxicity. a Western blot detecting HNRNPK and RRM2 levels. The upper panel shows the confirmation of reduced HNRNPK protein levels in HeLa cells transfected with HNRNPK siRNA and treated with DMSO or 10 µM CPT. In the middle panel, RRM2 protein levels in untransfected, control siRNA (siCtrl)- and HNRNPK siRNA (siHNRNPK)-transfected cells are presented. Total protein staining was used as loading control (lower panel). b, c Quantification of HNRNPK (b) and RRM2 (c) protein levels in untransfected CPT-treated cells, or in cells transfected with siCtrl or siHNRNPK (N = 4–5 experiments). d–g Quantification of HNRNPK (d, f) and RRM2 levels (e, g) in siCtrl- (d, e) or siHNRNPK-transfected cells (f, g) treated with DMSO or CPT (N = 5 experiments). h Western blot detecting reduced RRM2 levels in siHNRNPK-transfected cells compared to cells transfected with siCtrl and collected 4 h post-treatment (upper panel). No difference is observed between DMSO- and CPT-treated cells. Total protein staining was used as loading control (lower panel). i Quantification of RRM2 protein levels (N = 6 experiments). j, k Immunostaining of RRM2 in siCtrl- (j) and siHNRNPK-transfected cells (k). l Quantification of nuclear and cytoplasmic RRM2 protein levels measured as mean fluorescence intensity ratio (N = 3 experiments, 2 technical replicates). Each data point represents the average N/C ratio per replicate. In total, 10 images were analyzed per experiment and per condition. Scale bar = 50 µm. m, n Immunostaining of γH2AX foci in siCtrl- (m) and siHNRNPK-transfected (n) HeLa cells. Scale bar = 50 µm. o Quantification of the average number of γH2AX foci per cell (N = 3 experiments). p–s Immunostaining of γH2AX foci in GFP (p), 91S + GFP (q), 91S + HNRNPK (r) and 91S + RRM2 (s) RNA-injected 30 hpf zebrafish embryos. Dotted lines indicate the borders of the spinal cord. Scale bar = 50 µm. t Quantification of the fold change of γH2AX positive nuclei in the spinal cord of zebrafish embryos (N = 3 experiments). b–g, i, l, o, t Data represent mean ± SEM. Statistical significance was evaluated with one-way ANOVA and Tukey’s multiple comparison test (b, c, t), unpaired t test (d–g, l) or Kruskal–Wallis test and Dunn’s multiple comparison test (i, o); *P < 0.05, **P < 0.01, ***P < 0.001, ****P < 0.0001

