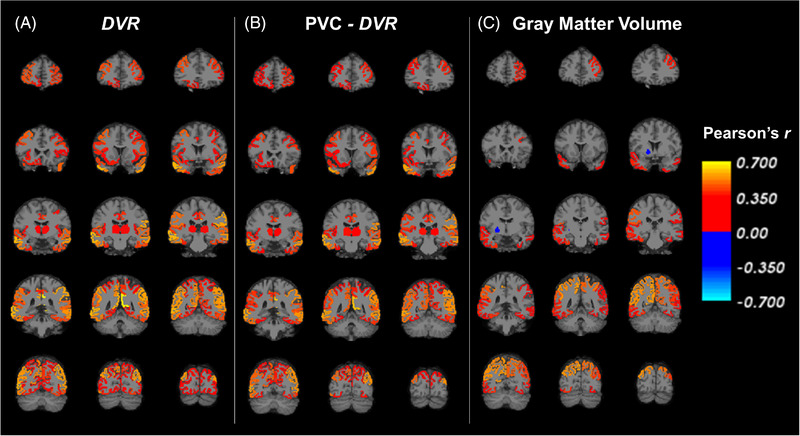
FIGURE 2.

Correlation maps of synaptic density (DVR) and global cognition in all regions for participants with AD. (A) Pearson's r was calculated for the correlation between synaptic density ([11C]UCB‐J DVR) and global cognition in all FreeSurfer regions. A similar analysis was conducted (B) after PVC of [11C]UCB‐J PET images, and (C) with gray matter volume. Brain maps were created by producing images with the voxels in each FreeSurfer region set uniformly to the calculated Pearson's r for that region and overlaid on an MNI template T1 MRI. The color scale represents Pearson's r, which is displayed only for regions that had an uncorrected P < 0.05. AD, Alzheimer's disease; DVR, distribution volume ratio of [11C]UCB‐J calculated with a whole cerebellum reference region; MNI, Montreal Neurological Institute; MRI, magnetic resonance imaging; PET, positron emission tomography; PVC, partial volume correction
