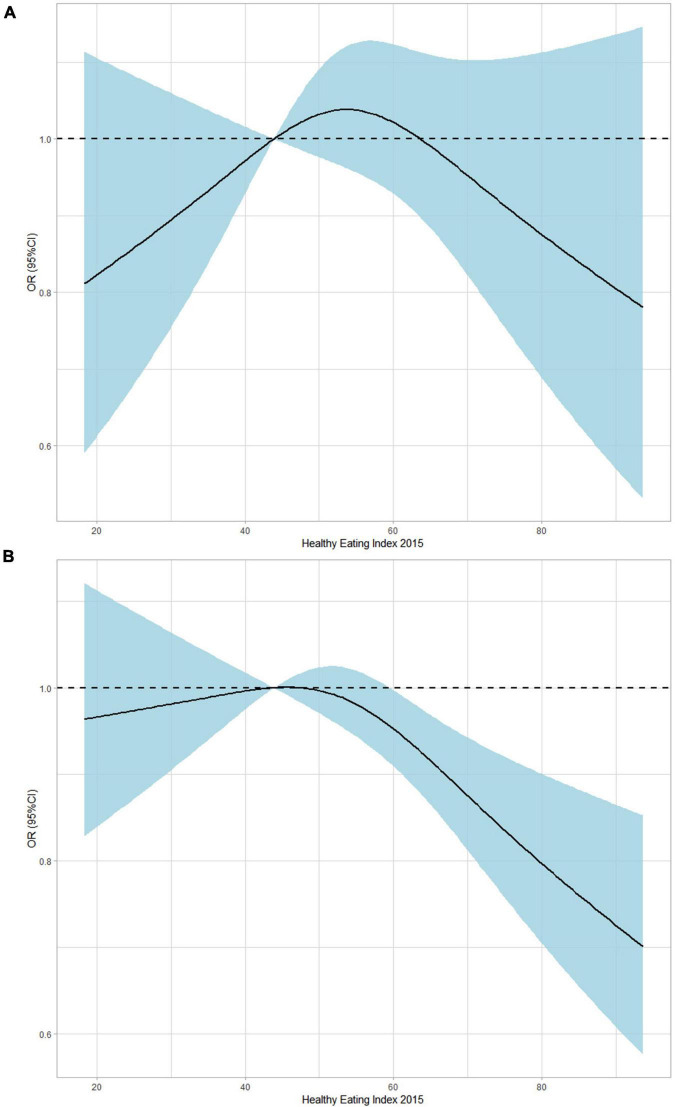
FIGURE 2.
Dose-response association between HEI (it continues) and gout/HUA using restricted cubic splines (RCS). The models of gout (A) were adjusted for sex, age group, race, education, family income, BMI, smoking, drinking status, hypertension, CKD, diabetes, and hyperuricemia. The models of HUA (B) were adjusted for sex, age group, race, education, family income, BMI, smoking, drinking status, hypertension, CKD, and diabetes.

