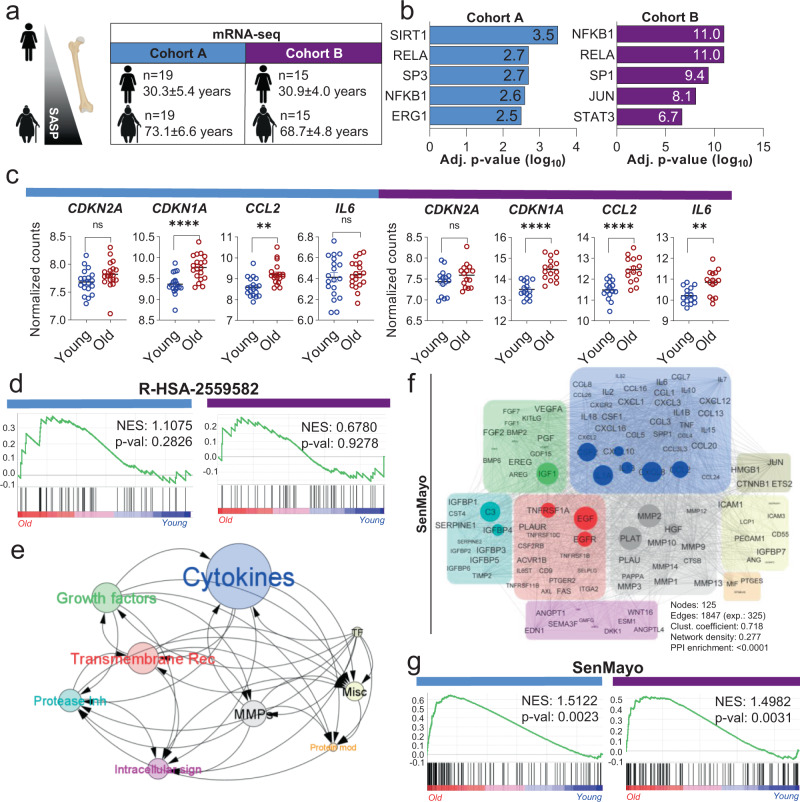
Fig. 1. Development and validation of the SenMayo gene set.
a Human samples from Cohort A (bone and bone marrow biopsies) and cohort B (highly enriched osteocyte fractions) were used for transcriptome-wide RNA-seq analyses; b Making use of TRRUST analyses30, we found several inflammation- and stress-associated genes, including SIRT1 and NFKB1, to be upregulated in the elderly women; p values were adjusted according to Benjamini–Hochberg. c In both gene sets, CDKN1A/P21Cip1 and several SASP markers such as CCL2 and IL6 showed consistent upregulation with aging, while CDKN2A/p16Ink4a (due to comparatively low expression) did not change significantly. Two-sided unpaired t-tests except for CCL2, where a Kolmogorov–Smirnov test was used (cohort A: CDKN2A: p = 0.0834; CDKN1A: p < 0.0001; CCL2: p = 0.0034; IL6: p = 0.6391; cohort B: CDKN2A: p = 0.1658, CDKN1A: p < 0.0001; CCL2: p < 0.0001, IL6: p = 0.0017). d The commonly used senescence/SASP gene set (R-HSA-2559582) failed to predict the aging process in either human cohort. Nominal p value, calculated as two-sided t-test, no adjustment since only one gene set was tested; e The SenMayo gene set includes growth factors, transmembrane receptors, and cytokines/chemokines that are highly influenced by other members of the gene set. The circle size depicts groupwise interactions, arrows point the direction of these interactions. f SenMayo encodes a dense network of nine different protein classes within a strong interaction network. The size of each circle represents the connectivity with other members of the gene set, grey lines represent interactions92; g Genes included in the SenMayo gene set were significantly enriched with aging in both human cohorts. Nominal p value, calculated as two-sided t-test, no adjustment since only one gene set was tested Cohort A: n = 38 (19 young, 19 old, all ♀), Cohort B: n = 30 (15 young, 15 old, all ♀). **p < 0.01, ****p < 0.0001. Fig. 1a was designed using Biorender.com. Depicted are mean ± SEM. Source data are provided as a Source Data file.

