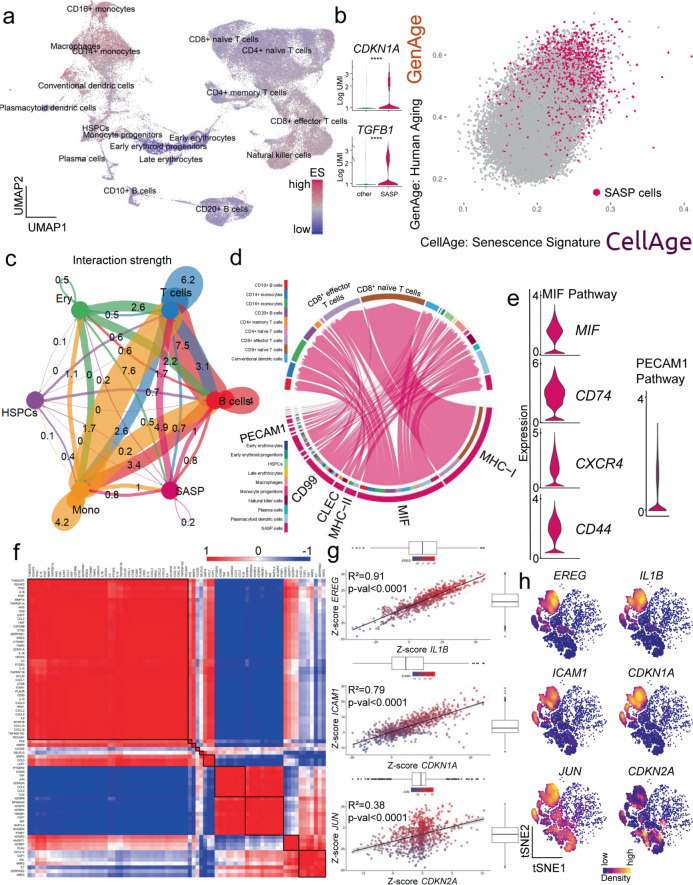
Fig. 4. SASP-associated hematopoietic cells in human bone marrow are mainly of monocytic origin and communicate via the MIF pathway.
a Using a previously published scRNA-seq dataset from human bone marrow (GSE12044648, n = 68,478 cells), we performed GSEA at the single cell level to uncover cells responsible for senescence/SASP-associated gene expression. The highest enrichment score (ES) for the SenMayo gene set (purple) occurred within the CD14+ and CD16+ monocytic cell cluster, represented in a Uniform Manifold Approximation and Projection (UMAP). We selected the top 10% of senescence/SASP-expressing cells to form the “SASP cells” (n = 6850 cells) cluster displaying an (b) independent enrichment of canonical senescence genes including CDKN1A/p21CIP1 and TGFB1 and which was likewise enriched for two aging signatures (GenAge: genes associated with aging in model organisms;49 and CellAge: positively regulated genes associated with aging in human cells (SASP cells are marked purple). T-test with adjustment for multiple testing according to the hurdle model from MAST package (CDKN1A: p < 0.0001; TGFB1: p < 0.0001). c The SASP cells showed the highest interaction strength with T cells in the bone marrow, the numbers represent the relative interaction strength as sum of interaction weights. Edge weights are proportional to interaction strength, and a thicker line refers to a stronger signal 52; d Among the interaction targets of SASP cells, T cells were predominantly targeted via the MHC-I, MIF, and PECAM1 pathways; e Members of the MIF and PECAM1 signaling pathways showed high expression patterns within the SASP population; f SASP cells were characterized by distinct co-expression patterns predicting functional clusters (e.g., JUN and CDKN2A), potentially overcoming difficulties of low expression of specific senescence-associated genes such as CDKN2A/P16ink4A. These strong indicators of co-expression were mathematically isolated by z-scores (Spearman correlation) (g) and spatially summarized (h) in sub-cell populations within the SASP cluster, as indicated by kernel gene-weighted density estimation in a t-distributed Stochastic Neighbor Embedding (tSNE) representation (EREG–IL1B: p < 0.0001, ICAM1–CDKN1A: p < 0.0001, JUN–CDKN2A: p < 0.0001). ****p < 0.0001, n = 22 (10 ♂, 12 ♀). The error bands show a confidence interval level of 0.95. Boxplot minimum is the smallest value within 1.5 times interquartile range below 25th percentile, maximum is the largest value within 1.5 times interquartile range above 75th percentile. Centre is the 50th percentile (median), box bounds 25th and 75th percentile. Source data are provided as a Source Data file.

