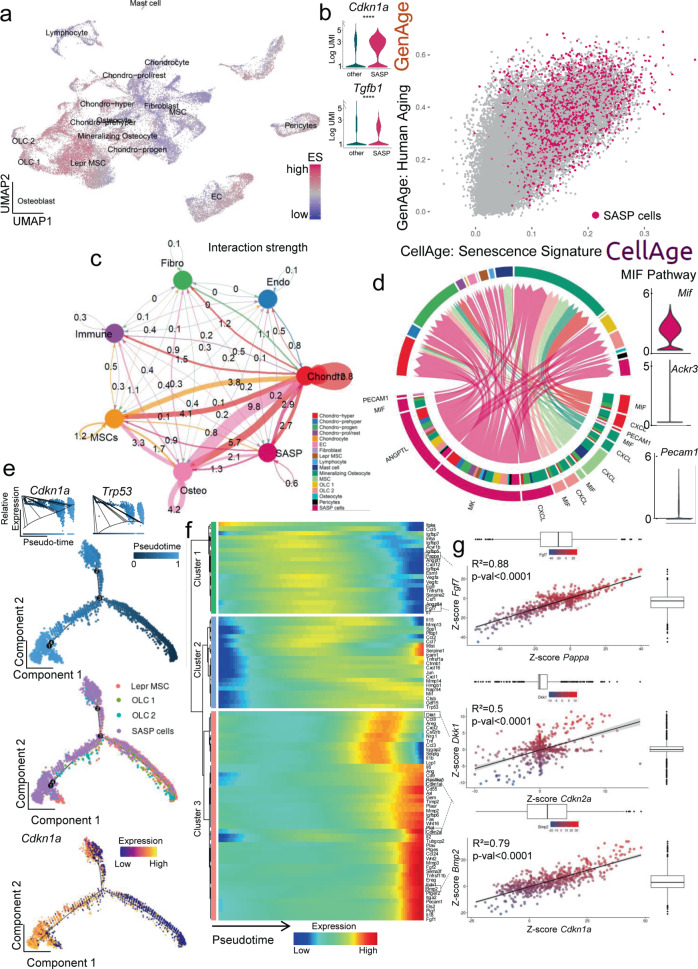
Fig. 5. In murine bone and bone marrow mesenchymal cells, osteolineage cells constitute the largest proportion of SASP cells and communicate with osteolineage and chondrocytic cells via the MIF and PECAM1 pathways and show characteristics of terminal differentiation.
a We analyzed a publicly available murine bone and bone marrow gene set (GSE12842354), and enriched 35,368 cells for the SenMayo gene set; b The top 10% senescence/SASP gene-expressing cells (n = 3537) were assigned to the “SASP cells” cluster. They displayed an increase in canonical markers of senescence including Cdkn1a/p21Cip1 and Tgfb1, and were enriched in the GenAge and CellAge gene sets (GenAge, CellAge49); T-test with adjustment for multiple testing according to the hurdle model from MAST package (Cdkn1a: p < 0.0001, Tgfb1: p < 0.0001). c The strongest interaction of the SASP cells was narrowed down to chondrocytic cells, while the osteolineage cells were another important crosstalk neighbor, the numbers represent the relative interaction strength as sum of interaction weights. Edge weights are proportional to interaction strength, and a thicker line refers to a stronger signal52. Two-sided unpaired t-test except for CCL2 in Cohort A: Kolmogorov–Smirnov test. d Outgoing interaction patterns of SASP cells (pink, left bottom quarter) indicated the importance of several signaling pathways that resulted in a significant enrichment of Mk, Angptl, Mif and Pecam1; (e) In pseudotime, the SASP cluster was most abundant in the terminal branches, and overexpressed Cdkn1a/p21Cip1 in terminal states (top-left inlay: the solid line represents the expression values as a function of pseudotime-progress, bottom red color on the left, terminal branch); f In their terminal differentiation, the SASP cluster was enriched in several factors, out of which distinct co-expressional patterns were extracted (Spearman correlation); g While the terminal differentiation was marked by a simultaneous loss of Pappa and Fgf7 (cluster 1, green in f), a significant correlation of Dkk1 with Cdkn2a/p16Ink41, likewise Bmp2 and Cdkn1a/p21Cip1, was mathematically predicted (cluster 2, pink in f). Fgf7–Pappa: p < 0.0001, Dkk1–Cdkn2a: p < 0.0001, Bmp2–Cdkn1a: p < 0.0001. ****p < 0.0001, n = 8 (4 bone, 4 bone marrow, all male). Depicted are mean ± SEM. The error bands show a confidence interval level of 0.95. Boxplot minimum is the smallest value within 1.5 times interquartile range below 25th percentile, maximum is the largest value within 1.5 times interquartile range above 75th percentile. Centre is the 50th percentile (median), box bounds 25th and 75th percentile. Source data are provided as a Source Data file.

